Clear Sky Science · en
Comprehensive evaluation of gas-bearing properties in ultra-deep basement reservoirs based on an optimizable support vector machine
Digging for Gas in the Deepest Rocks
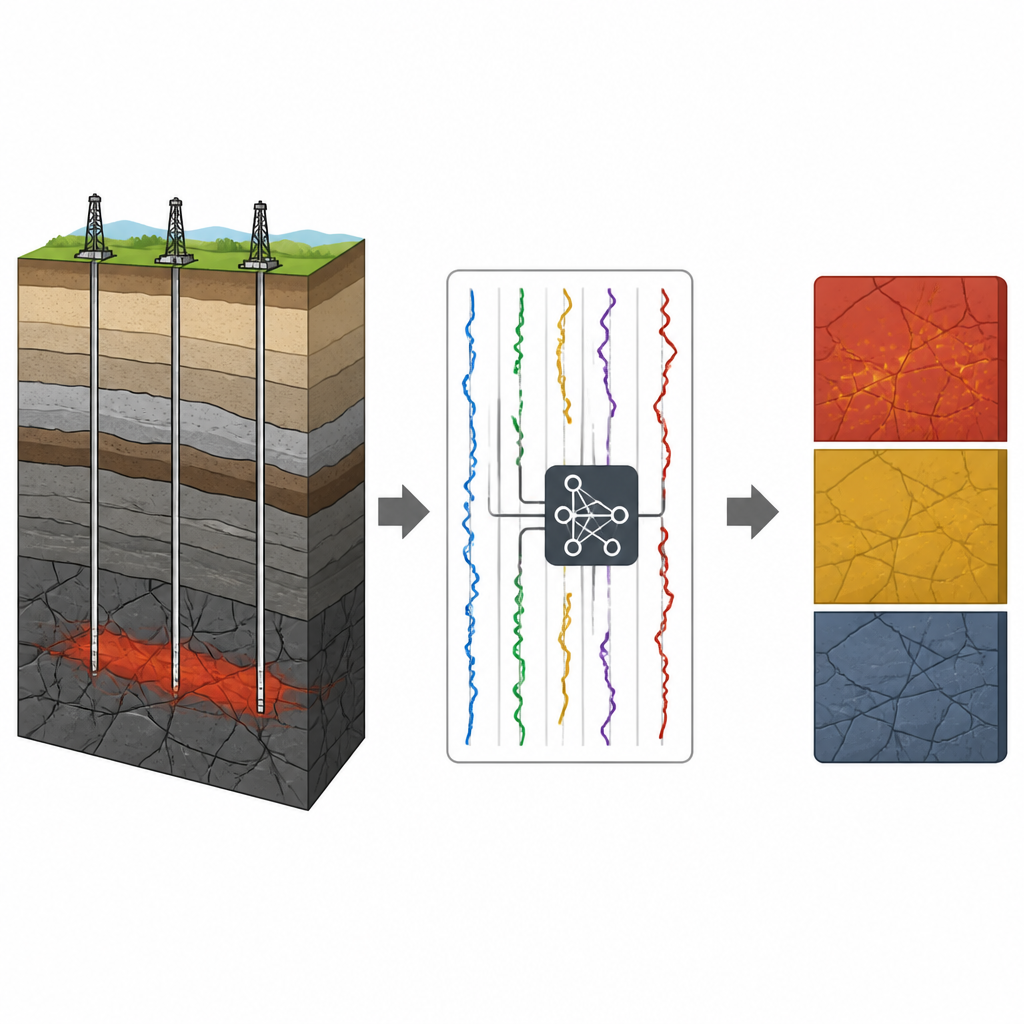
Far beneath the Earth’s surface, in rocks once thought too old and tight to matter, geologists are finding new stores of natural gas. These ultra-deep “basement” rocks sit more than six kilometers down, where heat, pressure, and complex rock types make it hard to tell where gas actually hides. This study explores how a type of machine learning can sort through confusing measurements from these depths to pinpoint which rock layers truly hold gas, helping companies drill fewer dry holes and manage these difficult reservoirs more safely.
A New Kind of Deep Gas Target
The research focuses on Block K2 in China’s Qaidam Basin, home to the world’s first ultra-deep basement gas reservoir with a burial depth beyond 6,500 meters. Here, gas is not stored in familiar sandstones but in ancient fractured basement rocks such as gneiss and diorite. These rocks are cut by networks of natural cracks and weathered zones that can store and transmit gas. Gas from younger Jurassic source rocks has migrated downward along faults into these broken basement zones, collecting in traps where gas overlies salty formation water. Because the rocks are so varied, measurements taken in the borehole respond more to changes in rock type than to whether pores are filled with gas or water.
Why Traditional Tools Fall Short
In many shallower reservoirs, engineers rely on a simple comparison of two porosity curves from neutron and density logs to spot gas: the curves cross in a characteristic way when gas is present. In the basement of Block K2, this rule of thumb breaks down. Some acidic rocks naturally have low density and low hydrogen content, mimicking the “gas signature” even when no gas is present. Other rocks altered by heat and fluids show high hydrogen content and different density behavior, again confusing the picture. As a result, the familiar curves overlap or shift in ways that do not reliably track fluid type, making it nearly impossible to draw clear lines between gas-rich and dry layers by eye alone.
Teaching a Machine to Read the Rocks
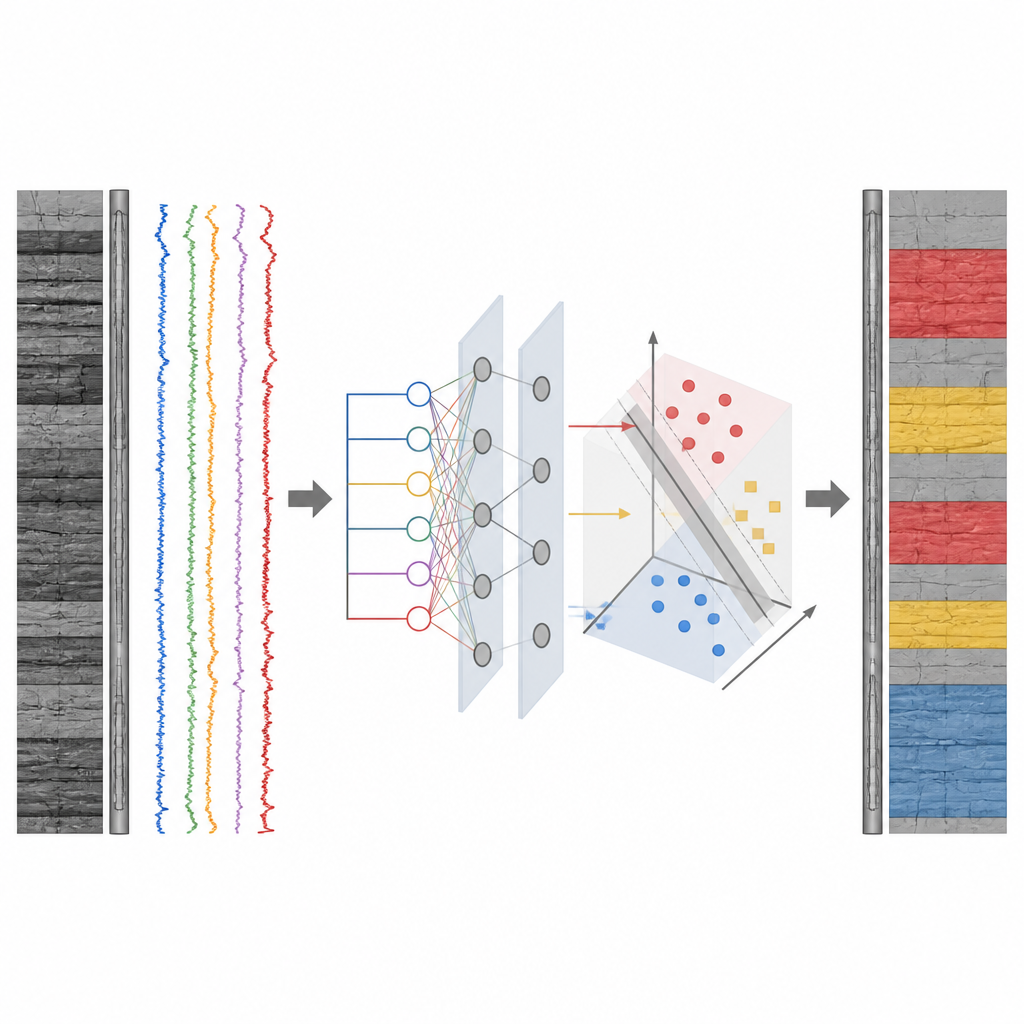
To overcome this problem, the team turns to an optimizable support vector machine, a well-known machine learning method suited to small but complex datasets. Instead of relying on a single pattern, the model takes in several logging measurements at once, including natural gamma ray, sound travel time, rock density, neutron response, deep and shallow electrical resistivity, and total hydrocarbon readings from gas logging. Each depth point in the wells is labeled as a strong gas layer, a weaker gas-bearing layer, or a dry layer using actual production test results. The algorithm then searches for the best way to separate these three groups in a high-dimensional space, automatically tuning key settings to balance accuracy and reliability.
How Well the Approach Works in Real Wells
After training on hundreds of depth samples, the model correctly classifies over 97 percent of the training data and about 95 percent of independent test data, with performance scores indicating very strong separation between categories. Applied to existing wells at different structural positions, the machine’s predictions line up closely with real production behavior: wells high on the structure, where the model finds thick gas layers, show strong and stable gas output with little water; wells lower down, with thinner predicted gas zones and less “height” above the gas–water contact, suffer lower gas rates and earlier water breakthrough. In a new well that was not part of model training, the tool guided the choice of perforation interval in the upper and middle basement section. That interval flowed more than 200,000 cubic meters of gas per day with no water, confirming the practical value of the predictions.
A Roadmap for Smarter Deep Drilling
Building on these results, the authors lay out a step-by-step workflow: carefully select and clean data; define consistent gas, gas-bearing, and dry layer categories tied to actual productivity; train and tune the machine learning model; compare predicted gas layers among wells; and then check and update the model with ongoing production data. For operators, the take-home message is straightforward. In difficult ultra-deep basement rocks where old rules fail, a well-trained machine learning model that blends multiple logging signals can provide a clearer picture of where gas really sits and which intervals are safest to open, supporting more efficient and better-informed development of these challenging resources.
Citation: Huang, X., Tang, J., Zhao, J. et al. Comprehensive evaluation of gas-bearing properties in ultra-deep basement reservoirs based on an optimizable support vector machine. Sci Rep 16, 15492 (2026). https://doi.org/10.1038/s41598-026-53786-9
Keywords: ultra-deep gas reservoir, basement rocks, well log analysis, support vector machine, gas-bearing prediction