Clear Sky Science · en
Analysis, control, and forecasting the dynamics of SIRD models with saturated treatment and nonlinear incidence
Why disease waves can look so unpredictable
Recent outbreaks have shown that epidemics do not always rise and fall in a single neat wave. Some linger, others pulse in repeated surges, and a few behave in ways that seem chaotic. This study explores why such complex patterns emerge and how smarter planning and forecasting can help health authorities respond more effectively and at lower cost.
A richer picture of how infections spread
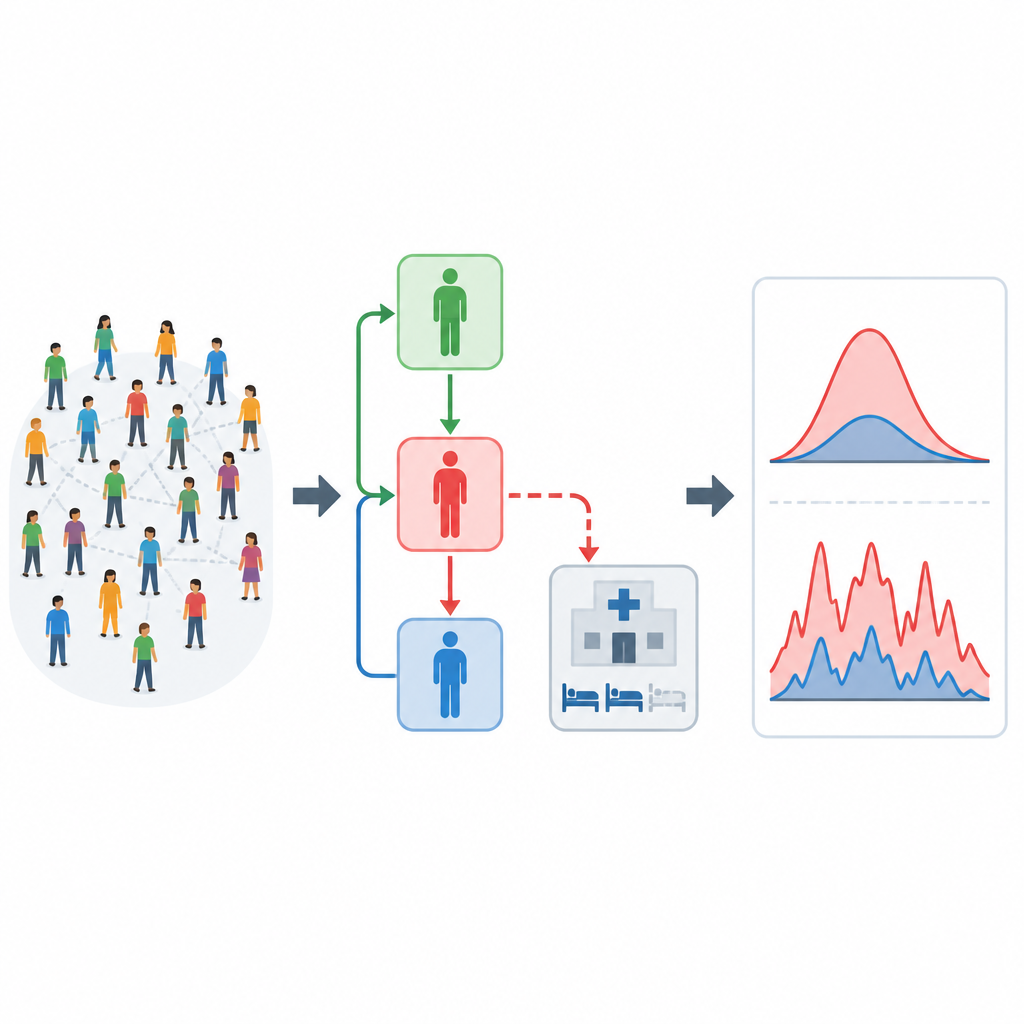
The authors build on the classic SIRD framework, which divides people into susceptible, infected, recovered, and deceased groups. Instead of assuming that people mix randomly and that infection risk simply scales with how many infected individuals there are, they allow the infection rate to grow faster than linearly at first, capturing superspreading and crowding effects. At the same time, they include a built-in brake: as more people become sick, others naturally reduce contact, mask more, or avoid gatherings. This push and pull between risky contact and self-protection makes the model better suited to dense cities and modern social behavior.
Health systems do not grow without limit
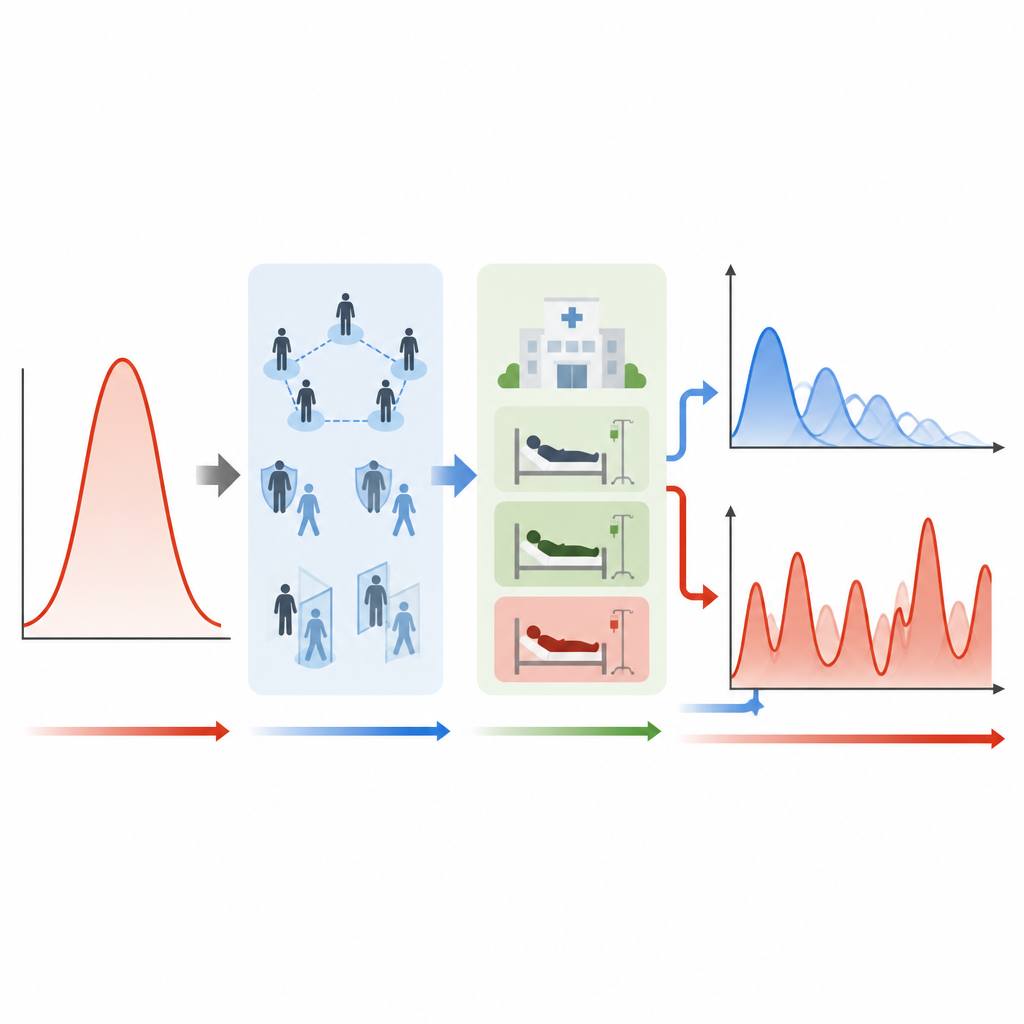
Another key ingredient is the way the model treats medical care. Rather than letting treatment capacity scale forever with demand, the authors assume that hospitals, staff, and drugs can only stretch so far. As patient numbers rise, each additional patient receives less effective care on average, and the overall benefit of treatment flattens out. People may still recover on their own, but the system can hit a practical ceiling in how many severe cases it can handle. By combining this treatment ceiling with realistic infection behavior, the model can reproduce patterns such as flattened peaks, prolonged plateaus, and sudden shifts between quiet and intense phases.
From steady states to cycles and chaos
Using tools from dynamical systems theory, the team maps out when the disease disappears, settles into a steady endemic level, or produces ongoing waves. They identify critical thresholds where the system’s behavior changes qualitatively, such as a point where a disease-free state becomes unstable and gives way to persistent infection. Under some conditions, the model predicts regular epidemic cycles; under others, tiny tweaks in population growth or contact rates can flip the system into chaotic behavior, where long-term forecasts become inherently unreliable. Surprisingly, the usual basic reproduction number is zero in this setup, meaning a single infected person cannot start an outbreak; instead, a critical mass of infections is required before waves can take off.
Designing smarter, adaptive interventions
Recognizing that public health measures have costs, the authors use optimal control theory to find time-varying strategies that jointly minimize illness, deaths, and intervention effort. They treat prevention measures like masking and distancing, and treatment intensity, as controls that can be dialed up or down over time. Their results show that combining both types of measures is far more effective than using either alone, especially when the underlying disease dynamics are oscillatory or chaotic. In the optimal strategies, prevention and treatment ramp up during predicted surges and ease off when infection levels fall, suggesting that flexible, data-driven policies can tame otherwise wild epidemic swings.
Forecasting complex outbreaks with simple machine learning
Because the model can produce very intricate patterns, the authors also test a lightweight machine learning tool called a Logistic-Map Reservoir Computer. This method converts past behavior of the epidemic into a high-dimensional internal signal and then uses a simple linear step to predict the future. Despite its simple structure, it tracks both smooth and oscillatory disease dynamics with high accuracy, and it outperforms more familiar deep learning approaches while using less computational power. The same approach can also learn how optimal interventions behave, opening the door to fast, real-time decision aids for health officials.
What this means for real-world health planning
Taken together, the model and its forecasting tools show that epidemic patterns can be inherently complex when human behavior and limited healthcare resources are accounted for, but they are not beyond our influence. With realistic models, adaptive control strategies, and efficient prediction methods, policymakers can better anticipate when small changes in behavior or capacity might trigger large swings in cases, and can plan combined prevention and treatment responses that reduce illness and death while making prudent use of scarce resources.
Citation: Elsonbaty, A., Ramaswamy, R., Padmaja, S. et al. Analysis, control, and forecasting the dynamics of SIRD models with saturated treatment and nonlinear incidence. Sci Rep 16, 15459 (2026). https://doi.org/10.1038/s41598-026-52772-5
Keywords: epidemic modeling, SIRD model, optimal control, chaotic dynamics, reservoir computing