Clear Sky Science · en
Integrating machine learning and multi-criteria decision analysis for health risk management in water distribution networks
Why safe tap water needs smart planning
When you turn on the tap, you expect clean water, but hidden beneath the street is a maze of aging pipes that can crack, leak, and let in germs. This study looks at how modern data tools can help water utilities see which pipes are most likely to fail, how dangerous those failures could be for health, and which repair strategies give the best protection for the money. It offers a practical way for cities to keep drinking water safe while dealing with limited budgets and old infrastructure.
Leaky pipes and hidden health risks
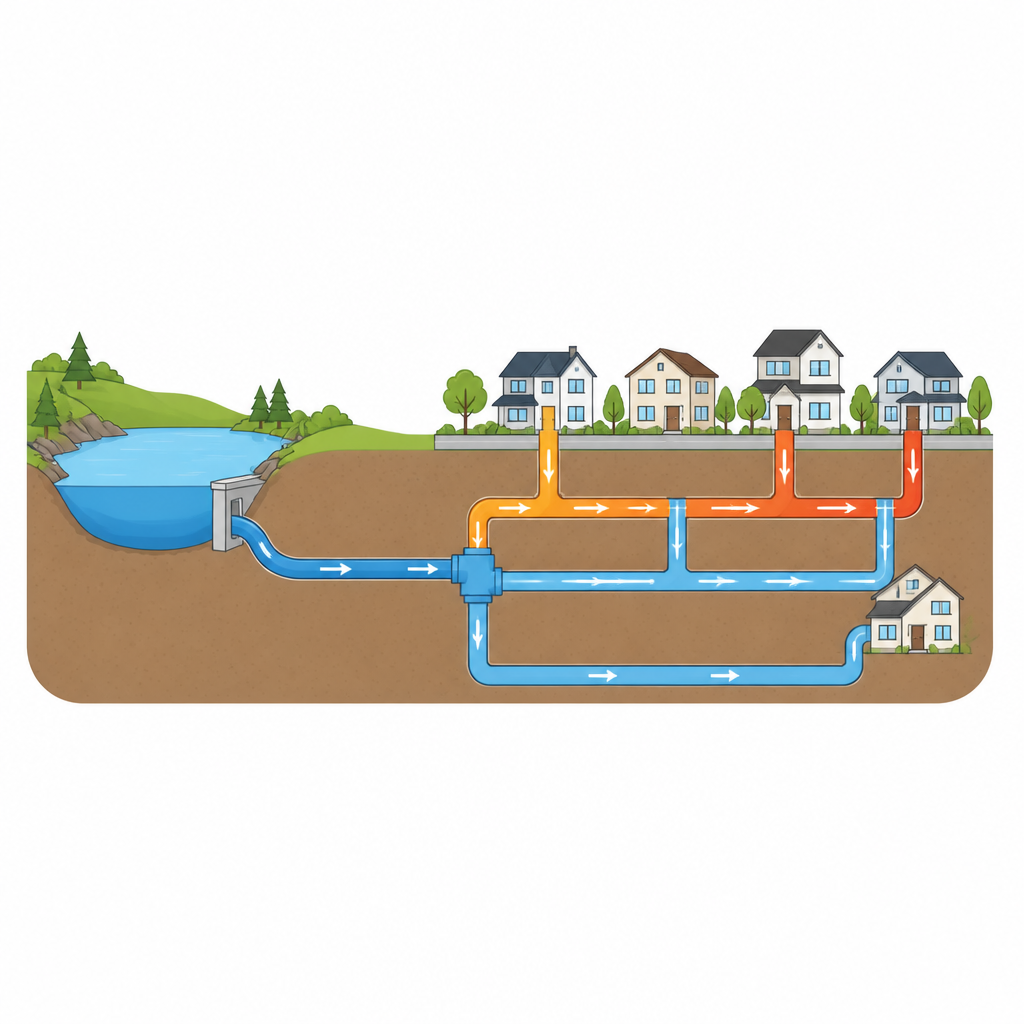
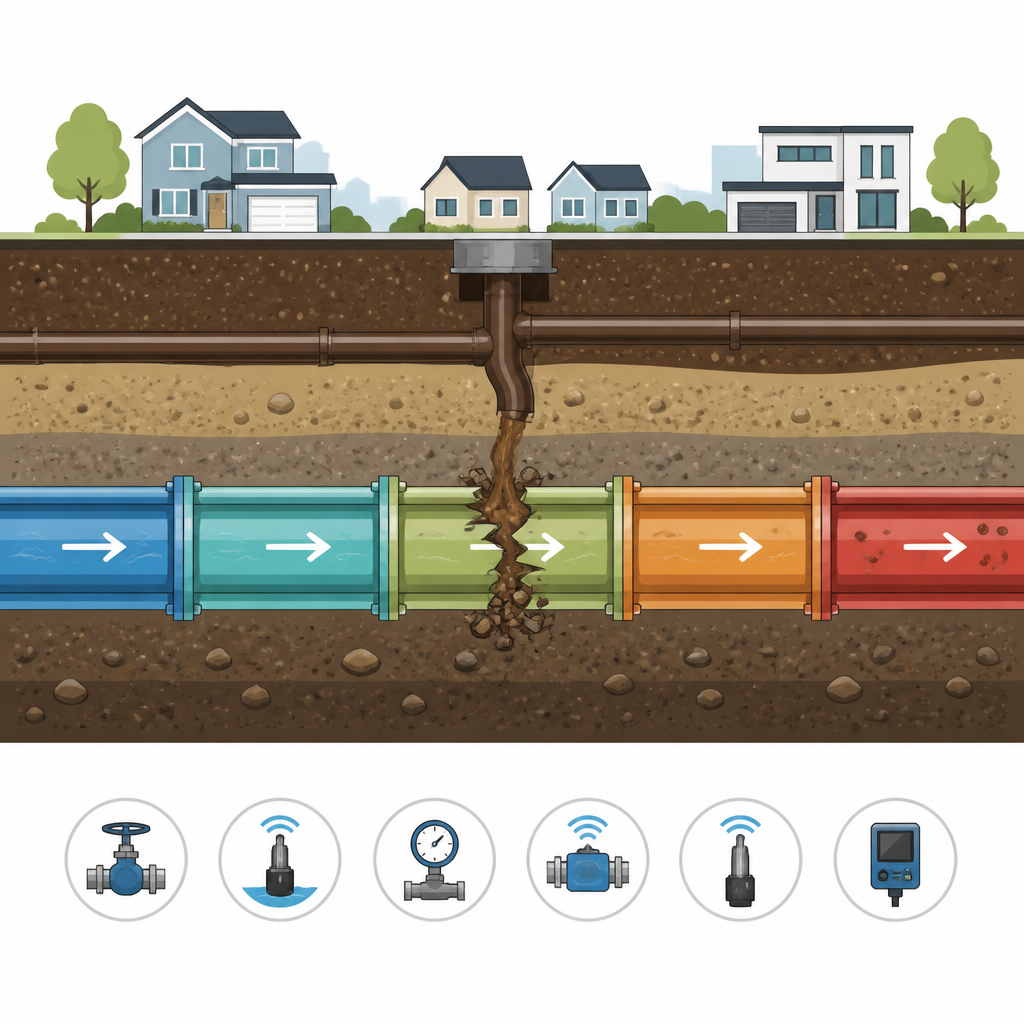
Water distribution networks move treated drinking water from treatment plants to homes and businesses. As pipes age, they develop cracks and breaks that waste huge amounts of water and cost money to fix. Globally, hundreds of millions of cubic meters of water are lost every day, and in Sweden alone around 15 to 20 percent of municipal drinking water disappears through leaks and breaks. These defects are more than a nuisance: when pressure in the pipes drops, dirty water from the surrounding soil or nearby sewers can be sucked in, carrying germs that cause stomach illness. Because utilities cannot replace every pipe at once, they need to know where failures are most likely and which ones would do the most harm.
Using data to find weak links in the network
The researchers worked with a real water network in southern Sweden, focusing on a 13.5 kilometer section with different pipe materials and ages. They used three types of machine learning models to estimate how likely each pipe was to break: logistic regression, random forest, and a method called XGBoost. These models looked at features such as pipe length, diameter, age, material, soil type, pressure, and past failures. The most accurate model, random forest, correctly identified most of the pipes that had failed in the last 20 years while rarely mislabeling healthy pipes. Age, material, and length turned out to be the strongest clues to future failure, confirming that basic physical information still tells a large part of the story.
Tracing how breaks affect flow and germs
Estimating the chance of a break is only half of the risk picture. The team also asked what would happen if each pipe actually failed. To do this, they used computer models of water flow to see how closing a pipe would disturb pressure and supply across the network. Pipes whose failure caused large drops in pressure or cut off large parts of the system were marked as having high hydraulic consequence. In parallel, they ran a microbial risk assessment, simulating how germs like Campylobacter, norovirus, and Cryptosporidium could enter through a break, move with the water, and reach consumers. For every pipe, they estimated the daily chance that a person drinking the water would get infected, flagging pipes where this risk rose above a commonly used safety target.
Turning complex risks into clear maps and choices
To combine these pieces, the researchers multiplied the probability of a pipe break by its combined hydraulic and health consequences, then mapped the results in a geographic information system. Pipes were grouped into low, medium, and high risk tiers so that engineers could quickly spot hotspots. But knowing which pipes are risky still leaves a difficult question: which actions should be taken first. To answer this, the team gathered ten water experts and asked them to score different strategies, such as pressure management, pipe repair, pipe replacement, more leak detection, and public awareness, using criteria like cost, ease of execution, risk reduction, social impact, and reliability. They then used a decision tool called TOPSIS to rank the strategies based on how well they met all criteria together.
What this means for safer drinking water
The analysis showed that managing pressure in the network, followed by targeted pipe repair and rehabilitation, offered the best overall balance of risk reduction, practicality, and cost. Full pipe replacement still matters, but is less efficient as a first step when money and staff time are limited. By tying together machine learning, flow and health risk models, expert judgment, and clear visual maps, the framework helps utilities decide where to act and which tools to use. For the public, the takeaway is straightforward: smarter use of data can help keep tap water safe by focusing attention and resources on the pipes that matter most before serious health problems occur.
Citation: Sangroula, U., Viñas, V., Odhiambo, M. et al. Integrating machine learning and multi-criteria decision analysis for health risk management in water distribution networks. Sci Rep 16, 15718 (2026). https://doi.org/10.1038/s41598-026-52465-z
Keywords: drinking water safety, water distribution pipes, machine learning, health risk assessment, leak management