Clear Sky Science · en
Cross-vendor reliability of functional and structural brain connectivity in a travelling cohort
Why Matching Brain Scans Matters
Modern brain research often relies on combining data from many hospitals and research centers. But what if two MRI machines, even when used on the same person, give slightly different pictures of how that person’s brain is wired and functions? This study asks how much the choice of scanner—specifically two popular high‑field MRI systems from different manufacturers—changes what we see about the brain’s communication networks, and whether clever statistical tools can correct for those differences.
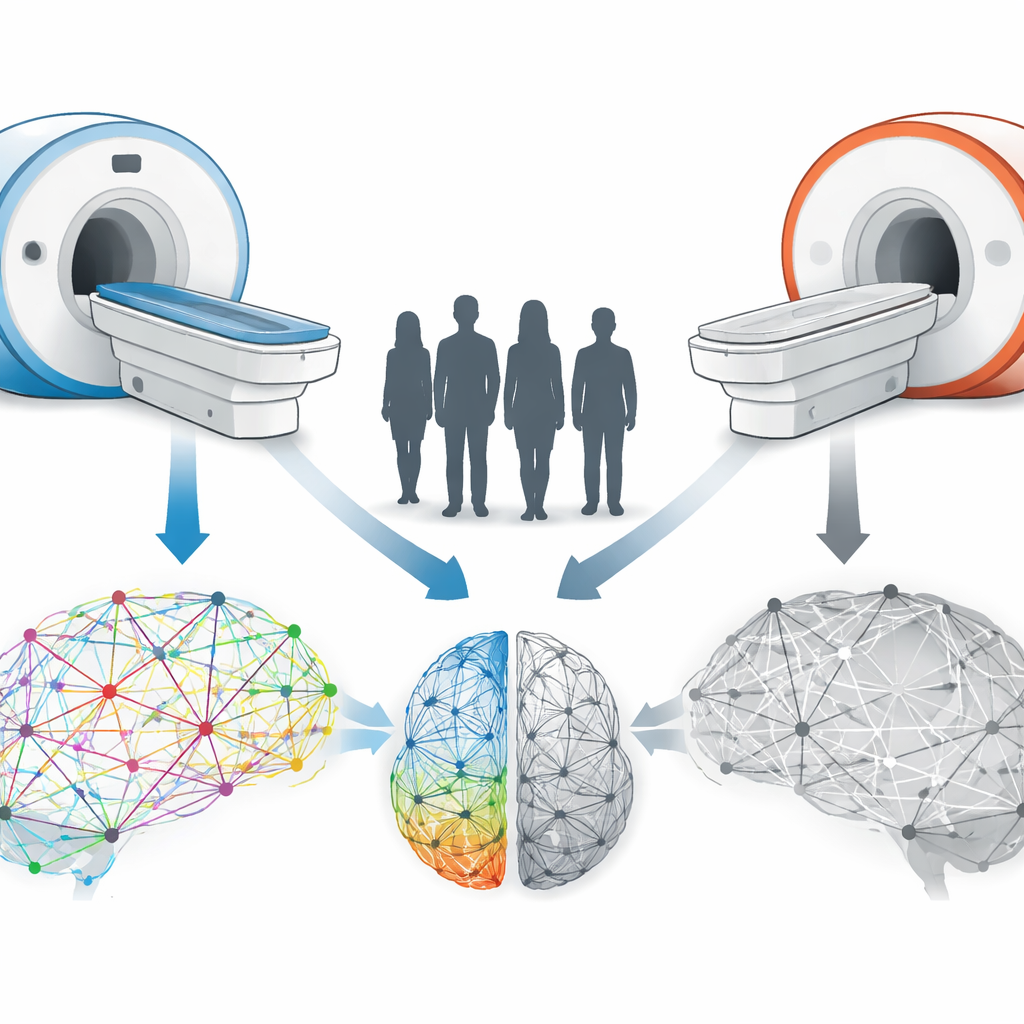
Two Machines, One Group of Travelers
The researchers recruited ten healthy young adults and quite literally sent them traveling between two MRI scanners in the same university setting: a Siemens Prisma 3T and a Philips Achieva 3.0T. Each participant was scanned on both machines within a week. From each scan, the team built two kinds of “maps” of the brain. One map captured functional connectivity—how strongly activity in different regions rises and falls together while a person simply rests in the scanner. The other map captured structural connectivity—the physical bundles of nerve fibers that link regions together, traced using diffusion imaging that follows the motion of water along nerve pathways.
Building the Brain’s Wiring Diagrams
To turn raw images into networks, the brain was divided into 246 regions. The team then asked, for every possible pair of regions, how closely their activity was synchronized (functional connectivity) and how many nerve fibers seemed to connect them (structural connectivity). Each region‑to‑region link is called an “edge” and, taken together, all edges form a connectome—a full wiring diagram of the brain. The scientists then computed statistical measures of reliability to see how similarly each edge was measured across the two scanners, both for individual people and for group averages.
How Stable Are These Brain Networks?
At the level of individual participants, the answers were sobering. Functional connectivity, which reflects moment‑to‑moment brain dynamics, showed poor consistency between scanners: the same person’s edge strengths often shifted substantially depending on which machine was used. Structural connectivity, which rests on the more stable anatomy of white‑matter tracts, fared better but still only reached fair reliability from one scanner to the other. In both cases, some brain regions—particularly deeper and emotion‑related areas—were especially unreliable, likely because they are harder to image cleanly and are more sensitive to technical quirks of each scanner.
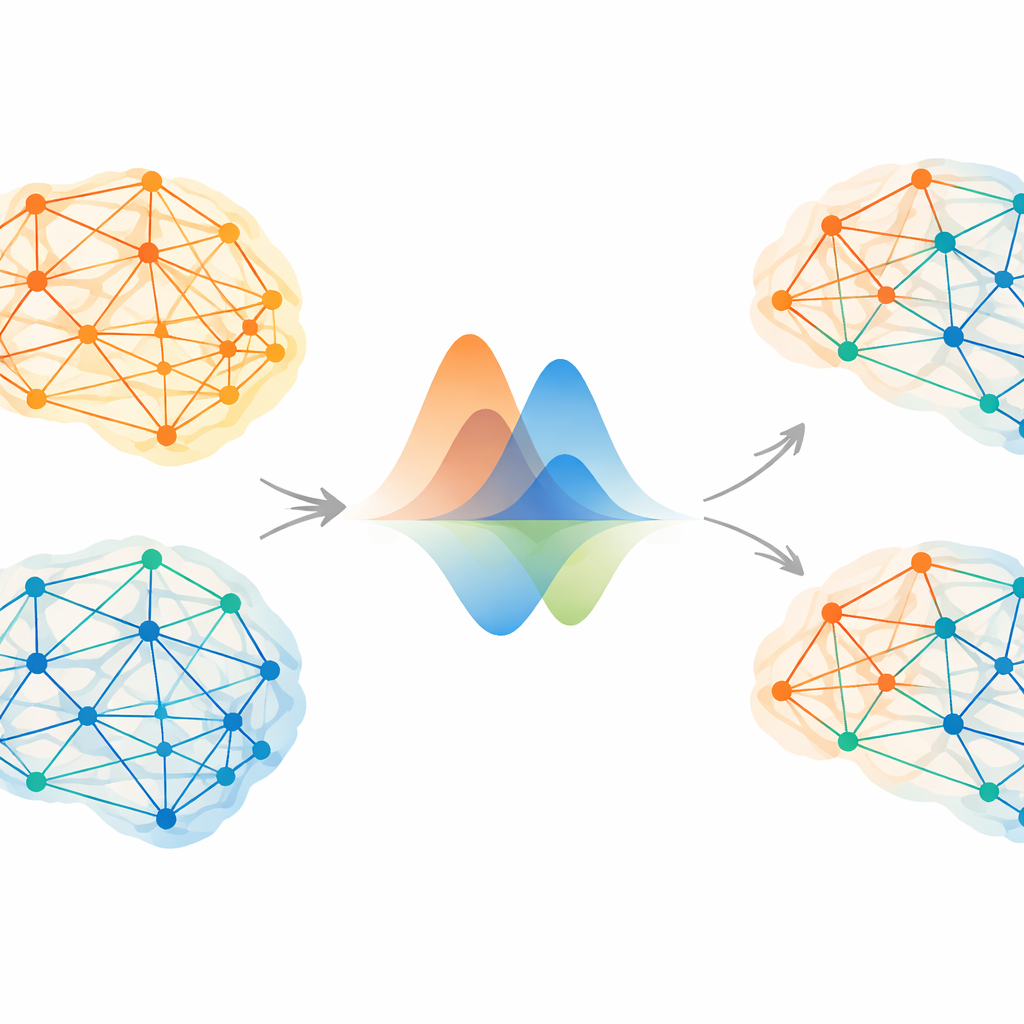
Cleaning Up Scanner Differences
Because fully standardizing hardware and software across centers is rarely possible, the team also tested a statistical “harmonization” method called neuroComBat. Rather than editing the images themselves, neuroComBat adjusts the derived numbers, aiming to remove scanner‑specific biases while preserving real biological differences between people. After applying this method, the proportion of variance in connectivity that could be blamed on the scanner dropped dramatically at the group level. When the researchers compared overall patterns of connectivity across all edges, the two scanners now produced strikingly similar group‑average connectomes, especially for structural connectivity.
What This Means for Big Brain Studies
The story was different for individuals. Even after harmonization, the reliability of single‑person measurements remained largely unchanged, especially for functional connectivity, where much of the variation seems to come from fluctuating brain states and random noise rather than from the scanner alone. The study concludes that physical wiring diagrams of the brain are inherently more stable across machines than functional maps of moment‑to‑moment activity. For large studies that focus on group differences, combining data across scanners is feasible, especially when harmonization methods like neuroComBat are used and scanner type is still treated cautiously in the analyses. But for applications that depend on precise, person‑level measures—such as tracking subtle disease progression or building individual “brain fingerprints”—researchers must be wary: a scanner switch can meaningfully change the picture, and current post‑hoc corrections are not yet a cure‑all.
Citation: Butry, L., Thomä, J., Forsting, J. et al. Cross-vendor reliability of functional and structural brain connectivity in a travelling cohort. Sci Rep 16, 12071 (2026). https://doi.org/10.1038/s41598-026-47705-1
Keywords: brain connectivity, MRI harmonization, multicenter imaging, functional connectivity, structural connectome