Clear Sky Science · en
Joint zonated quantification of multiple parameters in hepatic lobules
Why the liver’s hidden patterns matter
The liver does far more than filter our blood; it quietly balances energy, clears drugs, and handles toxins. Inside this organ, tiny building blocks called lobules are arranged so that different regions do different jobs. Many common liver problems, such as fatty liver disease, do not spread evenly but follow these internal patterns. This study shows how researchers can read those patterns more precisely, linking where damage occurs to where key drug processing proteins are active. The work could help explain why some parts of the liver are hit harder than others and how this might change the way medicines behave in diseased livers.
Looking inside the liver’s tiny neighborhoods
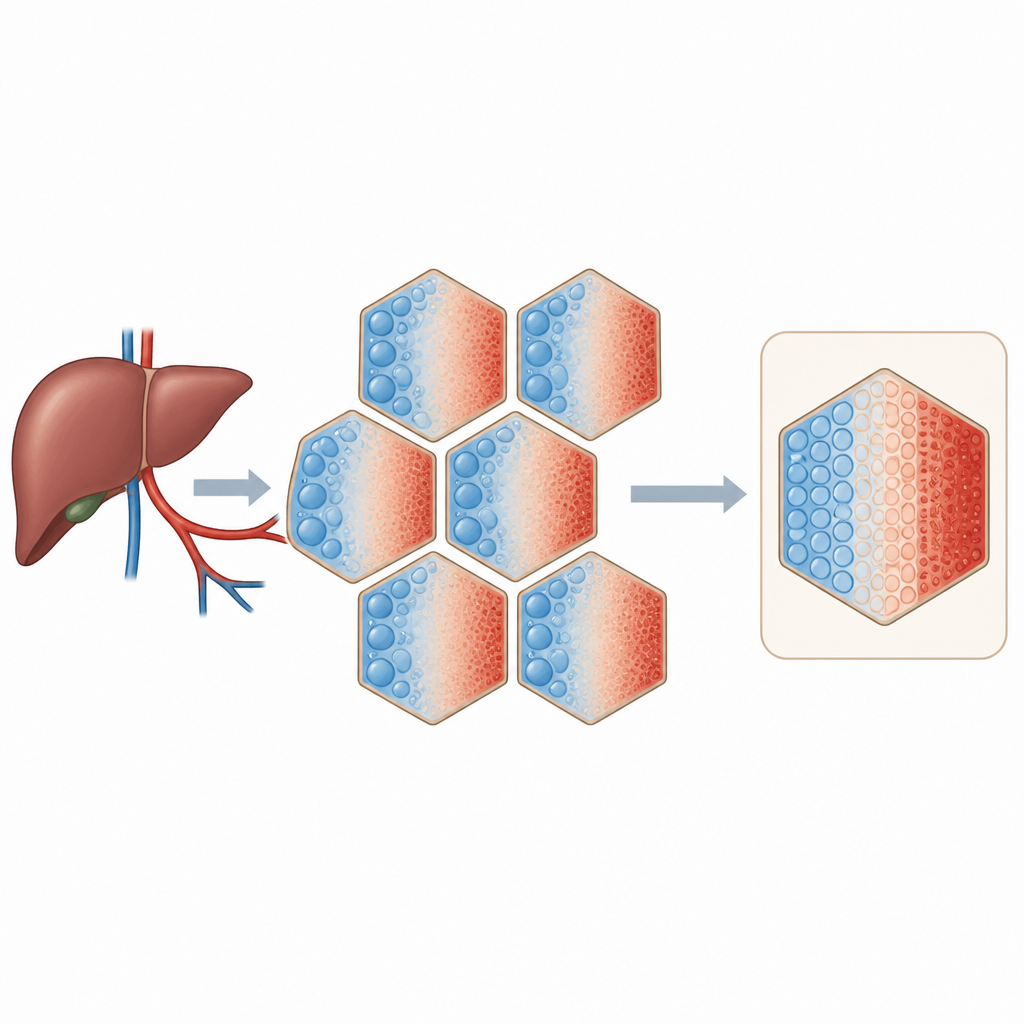
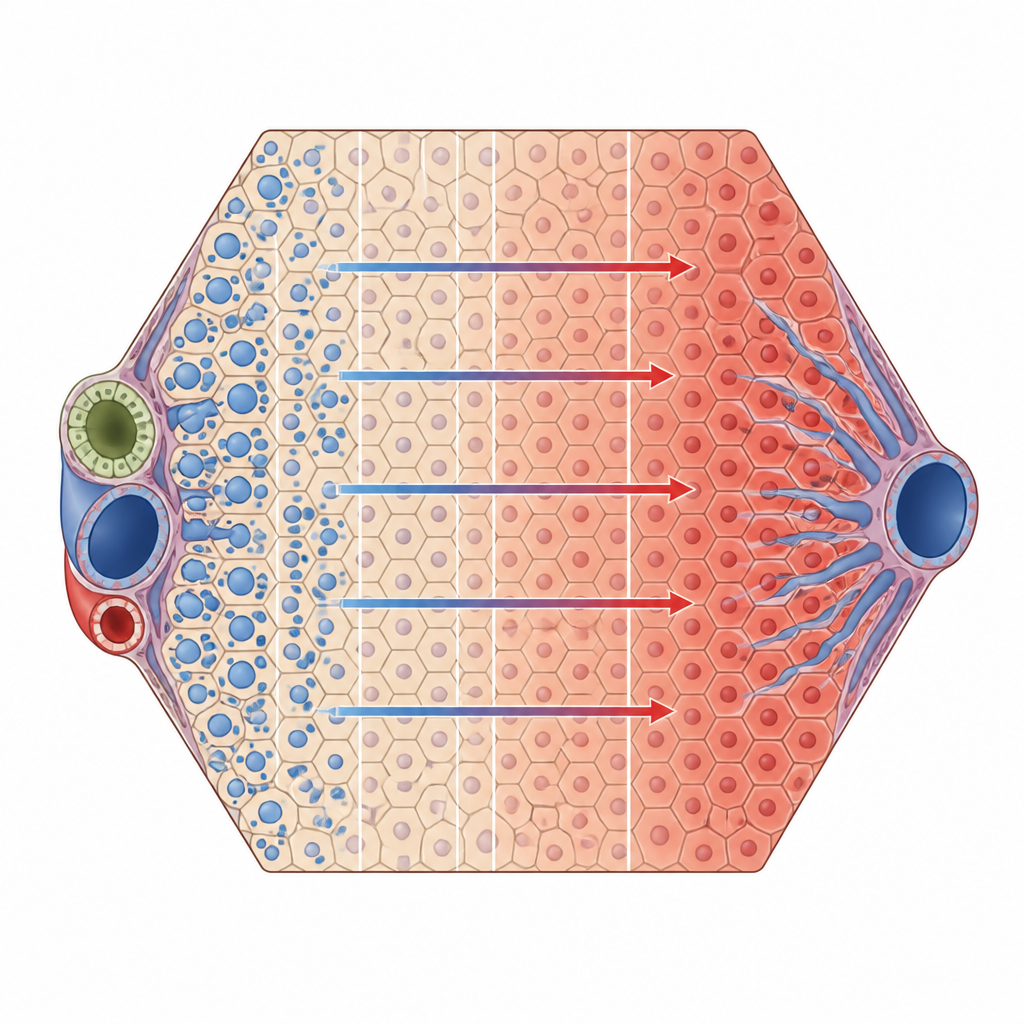
Each hepatic lobule can be thought of as a small neighborhood that stretches from a portal area, where fresh blood rich in oxygen and nutrients enters, to a central vein, where blood leaves. Along this path, cells gradually switch from building up substances to breaking them down. This organized change, called zonation, means that proteins and fats are not spread evenly. Some liver diseases, especially non-alcoholic fatty liver disease, also follow zonation, starting in certain regions and then spreading. To understand how disease and normal function interact, scientists need to measure both the damage and the important proteins along this internal axis at the same time.
Turning stained tissue into numbers
Pathologists often stain thin liver slices with different dyes to highlight fat, general structure, or specific proteins. However, each stain is applied to a different slice, so matching what happens in the same tiny region across stains is difficult. In this study, the team built a detailed image analysis pipeline for mouse liver tissue. They worked with small stacks of six neighboring sections from normal and fatty livers. One slice showed general structure, others showed a marker of a specific zone, and four slices showed drug processing enzymes from the cytochrome P450 family. Using advanced image registration, they carefully aligned all slides so that the same lobules and the same portal and central vessel locations could be identified in each stain.
Mapping zones of fat and enzymes together
Once the images were aligned, the researchers divided the space between portal areas and central veins in each lobule into twelve thin zones. They then used automated methods to detect large fat droplets and to classify stained pixels as either positive or negative for each protein. This allowed them to compute, zone by zone, how much of the tissue was filled with fat and how much carried each enzyme. They visualized these results in color maps that overlay fat and protein signals on the lobule geometry, and in scatter plots that show how the two measurements relate. In these views, blue areas highlight fat, red indicates protein, and magenta marks where both are present together.
What the patterns reveal about fatty liver
Applying this workflow to mice with different degrees of periportal fatty change, the team found that the well-known patterns of several key enzymes still held: many cytochrome P450 proteins and the reference marker GS remained strongest near the central vein, even when there was a lot of fat near the portal side. One enzyme, CYP2D6, stayed relatively even across the lobule, while others showed steep or gentle gradients. By fitting simple lines to these spatial trends, the researchers could summarize how fat content and enzyme presence change from one side of the lobule to the other and test whether steatosis clearly shifts those gradients. In the selected samples, the presence of fat did not appear to disrupt the zonal pattern of these enzymes.
Why this new view is useful
For a layperson, the key message is that this method acts like a detailed map that overlays where damage is located with where important liver functions occur, all within the tiny neighborhoods of the organ. Rather than just saying that a liver is fatty or that a protein is present, the approach shows how both vary from one end of a lobule to the other. While the current work is a proof of concept in a small number of mouse livers, the same strategy can now be used to study larger groups and other liver conditions. In time, such zonated maps could help researchers better predict how liver disease alters drug handling and guide more realistic computer models of liver function.
Citation: Laue, H., Budelmann, D., Albadry, M. et al. Joint zonated quantification of multiple parameters in hepatic lobules. Sci Rep 16, 15207 (2026). https://doi.org/10.1038/s41598-026-46721-5
Keywords: liver zonation, hepatic steatosis, cytochrome P450, image analysis, drug metabolism