Clear Sky Science · en
BoneDensityMapping: an R package for processing and visualizing bone density data
Why bone strength matters to all of us
As people live longer, broken bones from even minor falls are becoming more common, often leading to pain, surgery, and long recoveries. Doctors know that weaker, thinner bones are a big part of this problem, but current tests usually offer only a single score for an entire hip or spine region. This article introduces BoneDensityMapping, a free software toolkit that turns medical scans into vivid three dimensional maps, showing exactly where an individual bone is strong or weak and how those patterns differ between people.
From routine scans to detailed bone maps
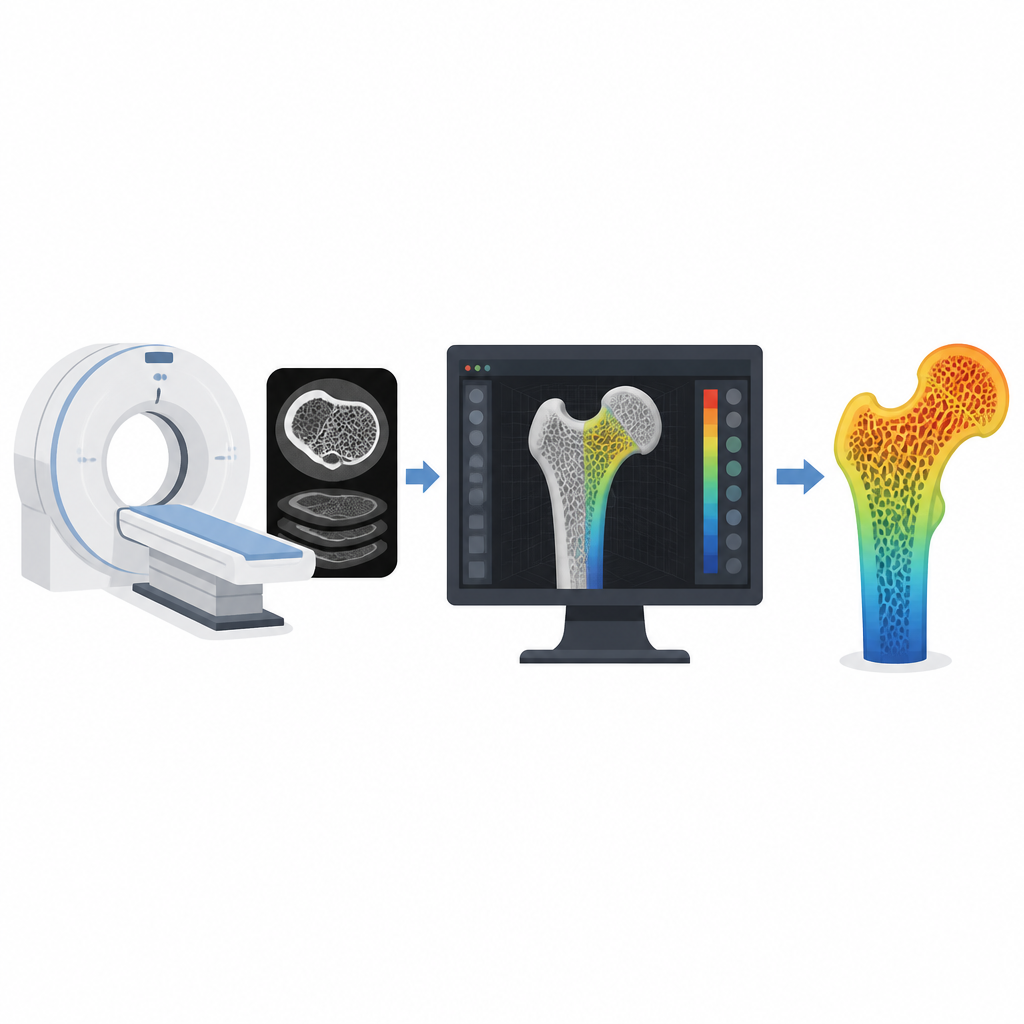
Modern computed tomography scanners already capture rich three dimensional pictures of our skeletons during many common medical exams. Quantitative computed tomography uses these scans to estimate how much mineral is packed into each tiny part of a bone, a key marker of strength. Unlike standard bone tests that average this information into a single number, this approach can reveal peaks and valleys of density across the bone surface and deep inside. The challenge is that such scans create huge, complex datasets that are difficult to process and interpret without specialized tools.
A toolbox built for clear and repeatable work
BoneDensityMapping is written in the R statistical language and is freely available for anyone to download. It offers a set of building block functions that guide users through a consistent workflow: bringing in scan files and three dimensional bone models, checking that they line up correctly, estimating density at the bone surface and interior, and turning those numbers into color coded images. The package works with common file formats used for medical images and three dimensional meshes, and it provides simple checks to ensure that landmarks and models sit inside the scan volume where they belong.
Seeing both the shell and the core of the bone
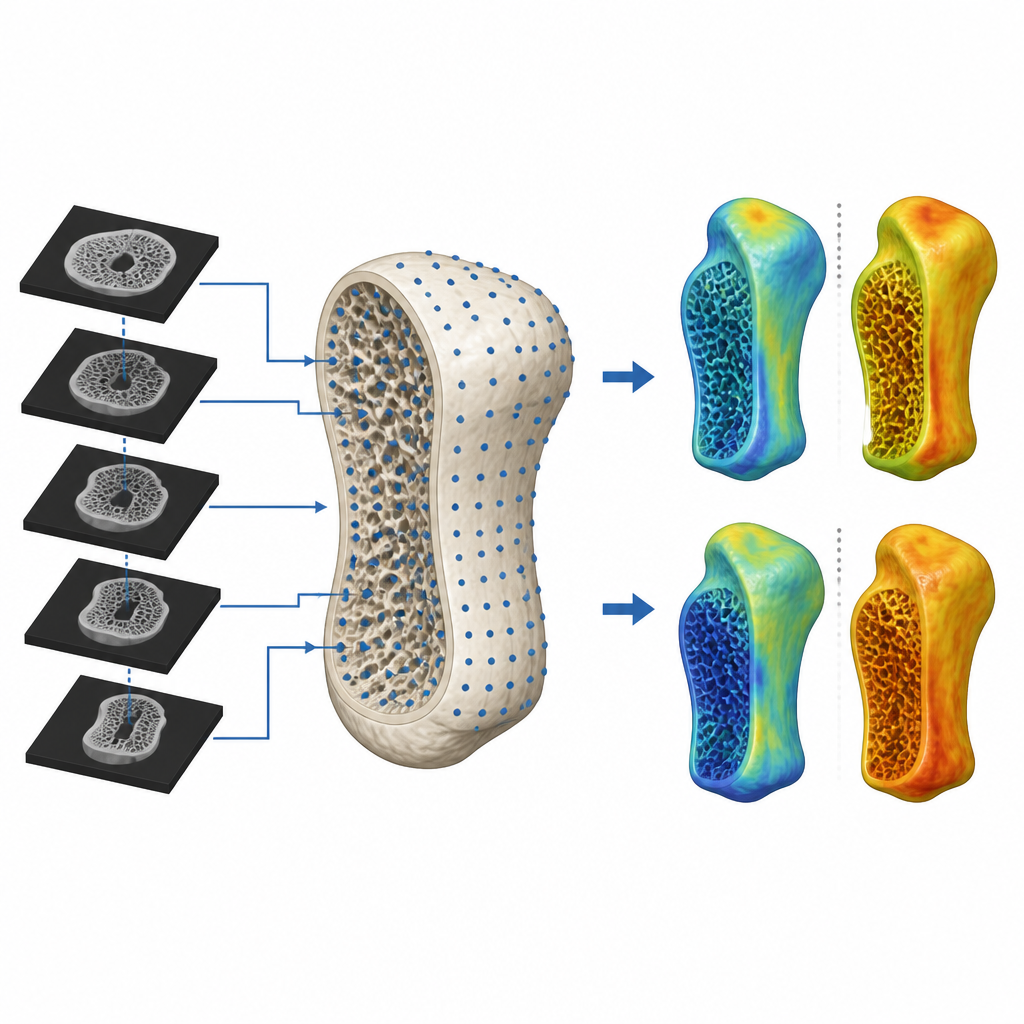
The software distinguishes between the hard outer shell of the bone and the spongy interior. For the outer shell, it can either read the density right where each surface point falls in the scan or trace a short line into the bone to find the highest density in that layer. For the interior, it fills the bone model with a grid of regularly spaced points and looks up the density at each one. These values are then translated into colors and painted onto the three dimensional model or onto cross sections, giving an intuitive picture of how strength is distributed throughout the bone in a single person or across many people.
Comparing bones across ages and groups
To show what the package can do, the authors analyzed six wrist bones from younger and older adults. They first chose one bone as a template and spread thousands of evenly spaced points across its surface. Using anatomical landmarks as anchors, matching points were found on every other bone so that the same spot could be compared from person to person. The software then estimated density at these corresponding points, averaged values across the whole set, and produced side by side maps for younger and older groups. Finally, it created a difference map on a single bone model, highlighting regions where older bones tended to be less dense than younger ones.
What this means for future care and research
The authors argue that making this type of analysis easy, transparent, and reproducible can help more clinics and research groups put existing scans to better use. Because the tools are open and script based, other scientists can inspect, reuse, and adapt the methods, or even extend them to other imaging types such as magnetic resonance scans that measure tissue density. While users still need separate tools to outline bones in the scans and some familiarity with R, planned additions such as automated landmarking and animations aim to lower these hurdles. Overall, BoneDensityMapping offers a practical way to turn large imaging datasets into clear pictures of bone strength, supporting better studies of aging, disease, and treatment.
Citation: Telfer, S., Lacambra, L. BoneDensityMapping: an R package for processing and visualizing bone density data. Sci Rep 16, 15324 (2026). https://doi.org/10.1038/s41598-026-46582-y
Keywords: bone density, osteoporosis, CT imaging, R software, scaphoid bone