Clear Sky Science · en
Soil classification in the Sudan Savanna using sentinel products and topographic information with machine learning models
Why Knowing the Ground Beneath Us Matters
In the semi‑arid heart of West Africa, farmers depend on sorghum and other staple crops grown in a landscape where rains are erratic and soils can change dramatically over just a few hundred meters. Yet detailed soil maps, the kind needed to decide which crops to plant and how to manage them, are often missing. This study shows how free satellite images and modern computer learning can be combined to draw much sharper soil maps for Burkina Faso’s Sudan Savanna, offering a practical tool for better harvests and land stewardship.
A Landscape That Hides Patterns in Plain Sight
The research focused on the Doulou basin in central Burkina Faso, a gently rolling plateau with small hills, shallow valleys, and a short but intense rainy season. Earlier fieldwork had shown that the main soil types in this region line up closely with position on the slope: shallow, stony soils on the upper plateau; moderately deep soils on middle slopes; deeper, more fertile soils downslope; and water‑logged soils in riverbeds. These differences matter for crop roots, water storage, and fertility. But until now, farmers and planners only had access to very coarse national and continental soil maps, which smoothed over most of this fine‑scale variation.
Watching the Soil from Space
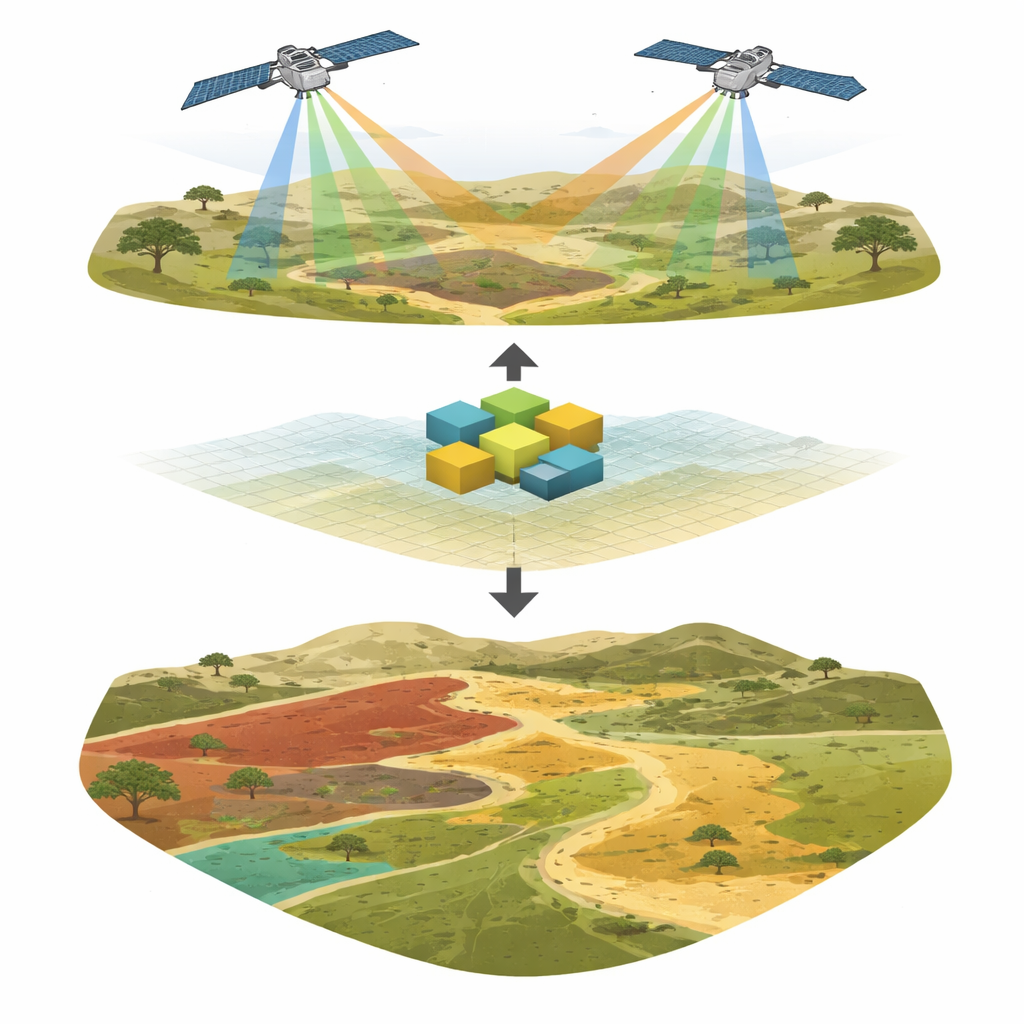
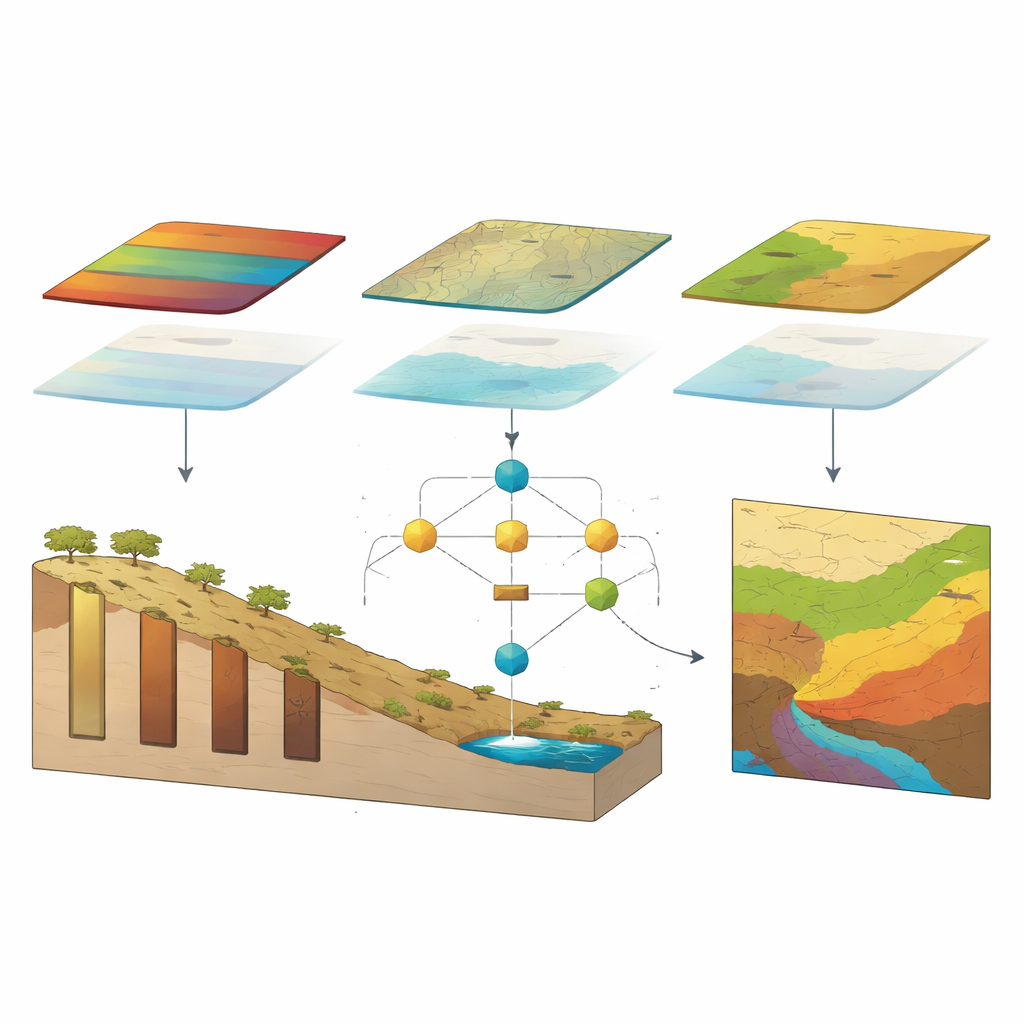
To capture this hidden pattern, the team combined three kinds of information. First, they used images from the European Sentinel‑2 satellite, which records reflected sunlight in several colors, including wavelengths sensitive to soil minerals and moisture. Second, they added radar data from Sentinel‑1, which can sense surface roughness and moisture even through clouds. Third, they calculated a “wetness” index from a high‑resolution digital elevation model, essentially a three‑dimensional picture of the terrain. This index estimates where rainwater tends to accumulate or run off, linking directly to how soils form along slopes. Field scientists had previously dug or sampled 141 soil profiles and classified them into four major soil groups, providing the ground truth needed to train and test computer models.
Teaching Machines to Read the Land
The researchers then tested three popular machine learning methods—Random Forest, Extreme Gradient Boosting (XGBoost), and Support Vector Machines—to see which could best match satellite‑derived features to the known soil types. They tried several input combinations, such as using only radar data, only optical data, or mixtures of these with the terrain‑based wetness index. The clear winner was XGBoost fed with Sentinel‑2 optical information plus the wetness index, reaching an overall accuracy of about four correct predictions out of five. Random Forest performed slightly less well, and the Support Vector Machine lagged behind. When the team examined which inputs mattered most, the wetness index came out on top, underscoring how strongly water flow and accumulation control soil patterns in this savanna landscape. Certain short‑wave infrared bands from Sentinel‑2 also ranked highly because they sense soil texture and moisture.
Drawing a Sharper Map for Farmers
Armed with the best‑performing model, the scientists produced a detailed soil map of the basin. The resulting picture shows shallow, gravelly soils dominating the upper plateau, medium‑depth soils on mid‑slopes, deeper and more fertile soils nearer the river, and wet, poorly drained soils confined to low‑lying channels. Compared with continent‑wide products and global soil grids, this map sharpens the boundaries between soil zones and corrects broad misclassifications. These finer details are more in line with what field surveys and local knowledge suggest, and they align with how water and sediment move downslope during heavy rains. Such information can guide where to plant sorghum or other crops, where to expect waterlogging, and where soil conservation or tree planting might be most urgent.
What This Means for Food and Future Planning
For non‑specialists, the key message is that it is now possible to create practical, field‑scale soil maps in data‑poor regions without years of expensive surveys. By letting satellites “read” the land and using machine learning to recognize patterns between slope, moisture, and soil, this study delivers a tool that can help farmers choose crops more wisely, target fertilizers, and protect fragile areas from erosion. While the approach still depends on some on‑the‑ground sampling and needs to be validated over larger areas, it points toward a future where detailed knowledge of the soil—once locked away in scattered pits and expert reports—can be made widely available across the Sudan Savanna and similar dryland regions.
Citation: Maung, W.S., Kenta, I., Toru, S. et al. Soil classification in the Sudan Savanna using sentinel products and topographic information with machine learning models. Sci Rep 16, 10880 (2026). https://doi.org/10.1038/s41598-026-46259-6
Keywords: digital soil mapping, remote sensing, machine learning, Sudan Savanna, agricultural planning