Clear Sky Science · en
Multi-site assessment of microtidal wave-dominated active beach state and morpho-sedimentary parameters using optical satellite imagery
Watching Waves from Space
For anyone who enjoys the beach, it may be surprising to learn that not all sandy shores behave the same way. Some are steep and reflective, sending waves bouncing back; others are gently sloping with wide surf zones that soak up wave energy. These different "moods" of the shoreline affect swimmer safety, erosion risk, and even where boats can land. This study shows how we can now use satellites, rather than people standing on the sand, to track how waves are interacting with beaches all around the world.
A Simple Distance with Big Meaning
The heart of the work is an idea that is simple to picture: measure how far offshore the main line of breaking waves is from the water’s edge. The authors call this distance Xb. If waves crash almost on the shoreline, Xb is small; if they start breaking far offshore and keep rolling in through a broad surf zone, Xb is large. This single distance turns out to be a powerful clue to how the beach is shaped under the water and how it is responding to incoming waves. Instead of trying to measure many hard-to-get quantities like sand size or underwater slope everywhere on Earth, the team asks: what can we infer just from where the waves are actually breaking?
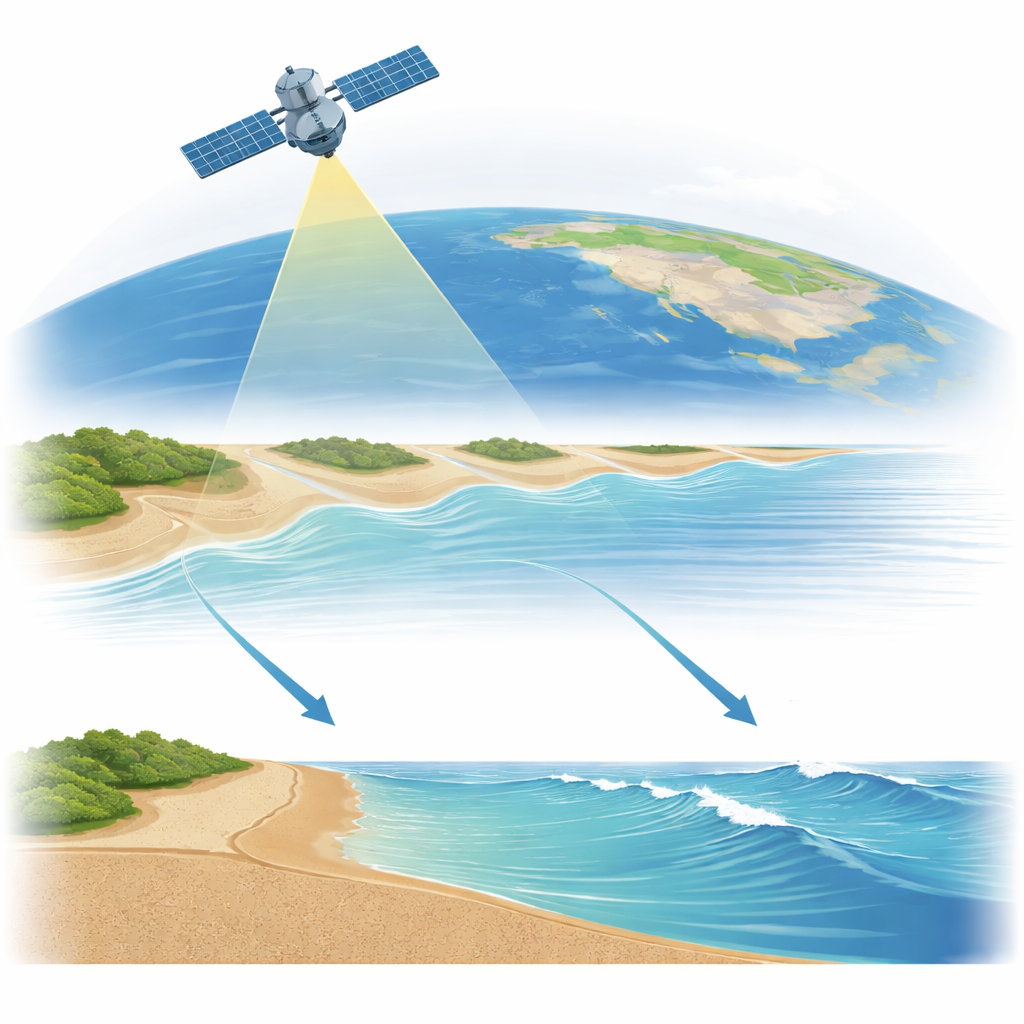
Turning Satellite Images into Surf Zone Maps
To track Xb, the researchers used ten years of images from the European Sentinel-2 satellites at 30 sandy beaches on five continents. They applied image-processing techniques to find two things in each picture: the shoreline, seen as the sharp boundary between land and water, and the bright patches of foam where waves are actively breaking. By drawing many shore-perpendicular lines across each site, they could locate both the shoreline and the breaking zone along each line and compute Xb as the difference. They then looked at the median value across all lines for each image, creating time series that show how this active wave–beach distance changes through seasons and years.
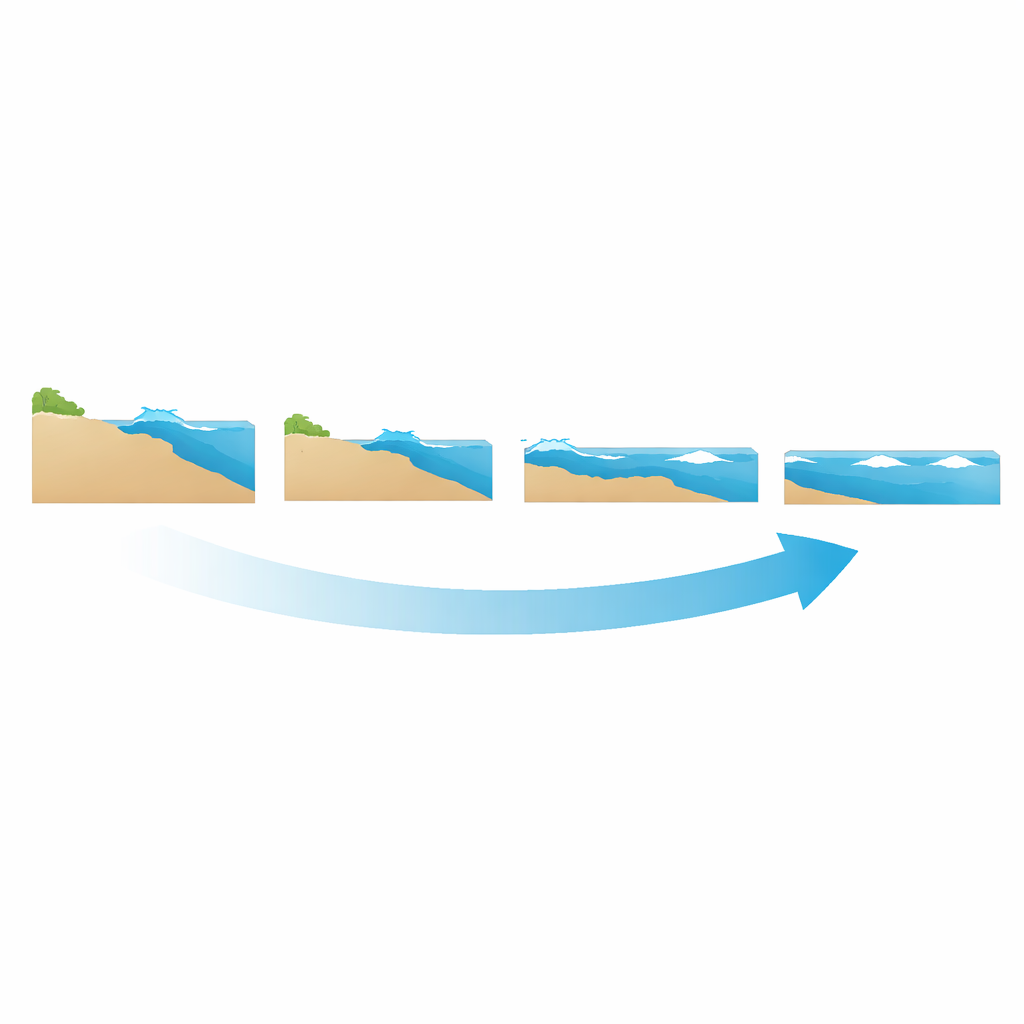
Reading Beach “Personalities” from Space
Coastal scientists have long described beaches along a spectrum from reflective (steep, narrow, often with coarser sand) to dissipative (gently sloping, wide surf zones, usually with finer sand), with several intermediate types governed by the presence and shape of sandbars. The new study shows that Xb naturally reproduces this classic ordering: reflective beaches have consistently small Xb, while more energetic, bar-filled beaches show larger values. By examining the full distributions of Xb, the team defined threshold ranges that separate five "active" states, from reflective to fully dissipative. Because Xb is continuous, it lets scientists watch beaches shift between states over time, estimate how often each state occurs, how long it tends to last, and how frequently transitions happen. At well-studied locations in Australia and the United States, these satellite-based patterns agree well with independent classifications from shore-based cameras and expert observations.
From Wave-Breaking Patterns to Hidden Sand
The distance to the breaking zone is not only a label for beach state; it also hints at hidden properties of the shore. By combining Xb with offshore wave information from global wave models, the authors linked it to two standard dimensionless measures that coastal scientists use to describe how waves and sand interact. From those links, they built simple empirical formulas that estimate two difficult-to-measure quantities worldwide: the typical grain size of the beach sand and the steepness of the beach face. While these first-guess estimates have uncertainties and can misjudge extreme cases or sheltered sites, they generally preserve the expected trend of coarser, steeper reflective beaches and finer, flatter dissipative ones. This means that, even where no field surveys exist, satellites can provide a rough but physically meaningful picture of the coastal seabed.
Why This Matters for Coasts and People
By focusing on what satellites can directly see—the moving line where waves break relative to the shoreline—this work offers a scalable way to monitor how beaches function, not just how they look. The Xb metric captures the active state of the shore: whether waves are spending their energy on offshore bars, terraces, or directly on the beach face. That, in turn, influences rip-current hazards, erosion risk, and the natural buffering of storm waves. Although more refinement is needed, especially in strongly tidal or sheltered regions, the approach opens a path toward routine, region-to-global assessments of sandy coasts using existing satellite archives. For coastal communities and planners, it means that the changing behavior of their beaches can increasingly be watched—and compared across continents—from space.
Citation: Frugier, S., Almar, R., Bergsma, E.W.J. et al. Multi-site assessment of microtidal wave-dominated active beach state and morpho-sedimentary parameters using optical satellite imagery. Sci Rep 16, 10949 (2026). https://doi.org/10.1038/s41598-026-45638-3
Keywords: beach morphodynamics, satellite coastal monitoring, wave breaking, shoreline change, surf zone dynamics