Clear Sky Science · en
Synergistic predictive value of dynamic glycemic trajectories and variability metrics for 28-day mortality in critically ill heart failure
Why blood sugar swings matter in the ICU
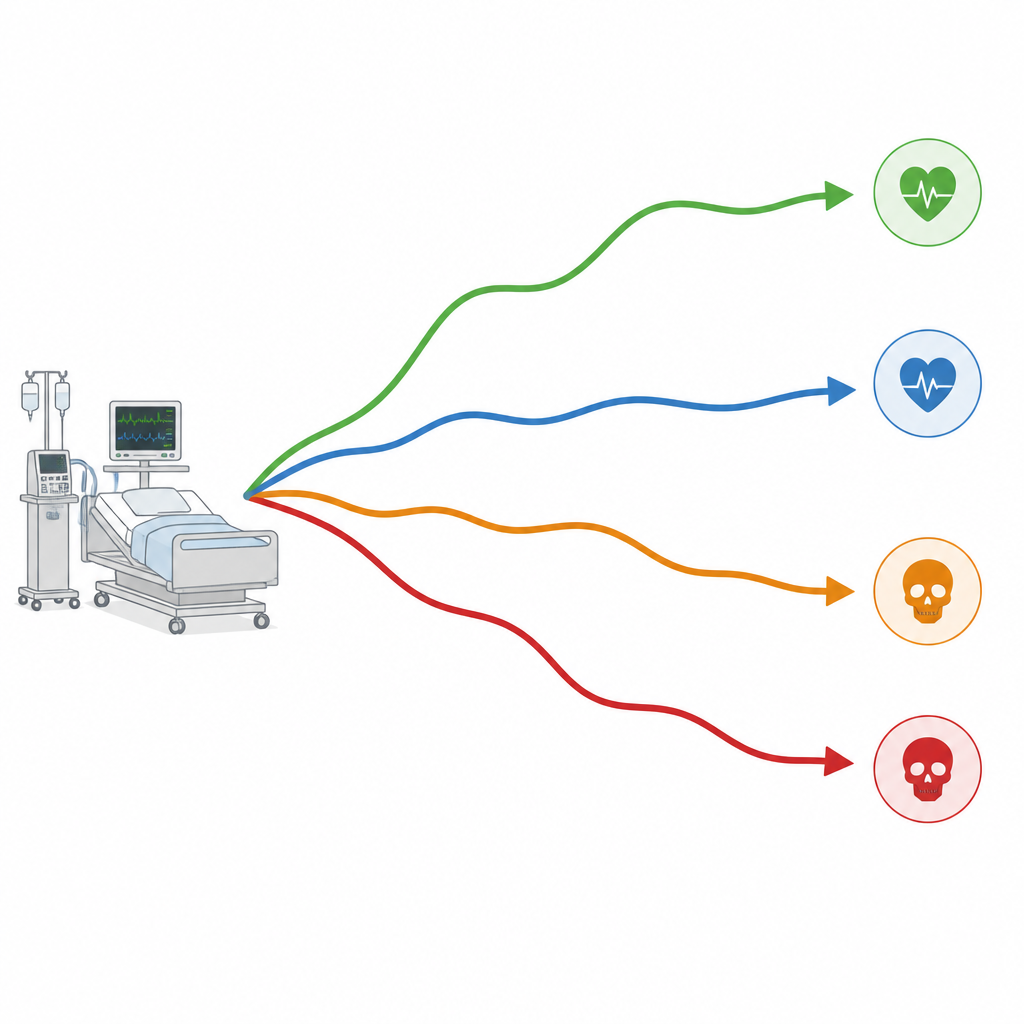
When people with severe heart failure land in an intensive care unit, doctors watch many numbers, including blood sugar. This study asks a simple but important question: instead of looking at a single sugar reading or how “bouncy” it is overall, can the pattern of sugar over the first few days help predict who is more likely to survive the next month?
Following sugar paths over time
The researchers used a large public hospital database from Boston that stores detailed records from tens of thousands of ICU stays. From this trove they focused on more than six thousand adults with severe heart failure who stayed in the ICU at least four days and had daily blood sugar checks. For each person, they averaged all sugar measurements taken on each of the first four days, then used these daily averages to trace an individual path, or “trajectory,” of blood sugar over time.
Four common patterns emerge
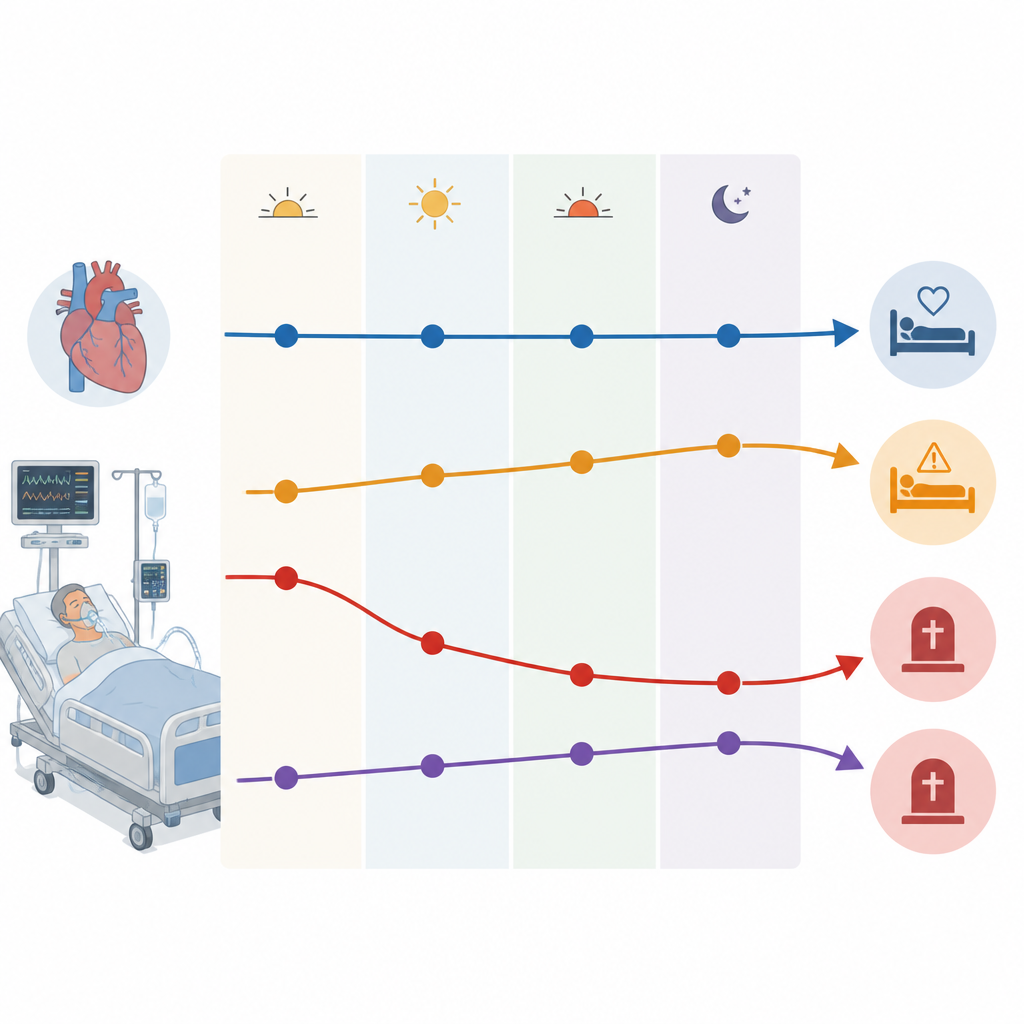
Using a statistical tool that groups similar paths together, the team found four main sugar patterns. The largest group had relatively low sugar levels that gently drifted down over the four days. A second group started with moderately high sugar that climbed slowly higher. A third smaller group arrived with very high sugar that dropped quickly. The smallest group started high and continued to rise. In parallel, the scientists also calculated how much each person’s sugar readings bounced around overall, a common measure of sugar variability.
Linking patterns to survival
The study then tracked whether patients were alive 28 days after ICU admission. About one in five died in that time. When the team compared the four sugar paths, they found clear differences in survival. Patients with low, gently falling sugar had the best outcomes. Those whose sugar started very high but dropped quickly did worse, but still fared better than patients whose sugar was only moderately high yet crept upward. The worst outcomes were seen in the group whose high sugar continued to rise. Survival curves showed that these four paths separated more cleanly than groups based only on overall sugar variability, suggesting that the direction and speed of change carry extra information.
Added insight beyond simple averages
To test whether these patterns truly added predictive value, the researchers built several risk models that also included age, illness severity scores, other lab tests, and medical history. Models that used sugar paths outperformed those that relied only on how variable sugar was. In other words, knowing whether a patient’s sugar is drifting down, flat, or steadily climbing over a few days helps sharpen estimates of short term death risk, even after accounting for many other clinical factors. Subgroup analyses suggested that these patterns may be especially informative in patients without diabetes, and that the effects of insulin treatment may complicate the picture in some groups.
What this means for patients and clinicians
For people with severe heart failure in the ICU, this work suggests that how blood sugar changes over the first several days may matter as much as the absolute level. A slow rise in sugar, even from a moderate starting point, may be a warning sign of ongoing stress or inadequate control, while a sharp early drop from a very high level may signal a more responsive state. The authors conclude that tracking short term sugar paths, alongside more familiar variability measures, could help clinicians better gauge which patients are at higher risk within the first month and may benefit from closer monitoring or tailored care.
Citation: Cai, Py., Lin, Wz., Chen, Sh. et al. Synergistic predictive value of dynamic glycemic trajectories and variability metrics for 28-day mortality in critically ill heart failure. Sci Rep 16, 15545 (2026). https://doi.org/10.1038/s41598-026-45217-6
Keywords: heart failure, intensive care, blood glucose, mortality risk, glucose variability