Clear Sky Science · en
Discovery of key surface electromyography features during walking for discerning high and low muscle mass using machine learning analysis
Why your walk says more than you think
Most people think of muscle loss as a problem of old age, yet the amount of muscle we carry in early and mid‑life can shape how well we move and stay healthy later on. Standard tests for muscle mass require bulky machines and clinic visits. This study explores whether a simple walk, recorded with small sensors on the legs and analyzed by computer, can reveal who has relatively low or high muscle mass, even among otherwise healthy adults.
Listening to muscles while you move
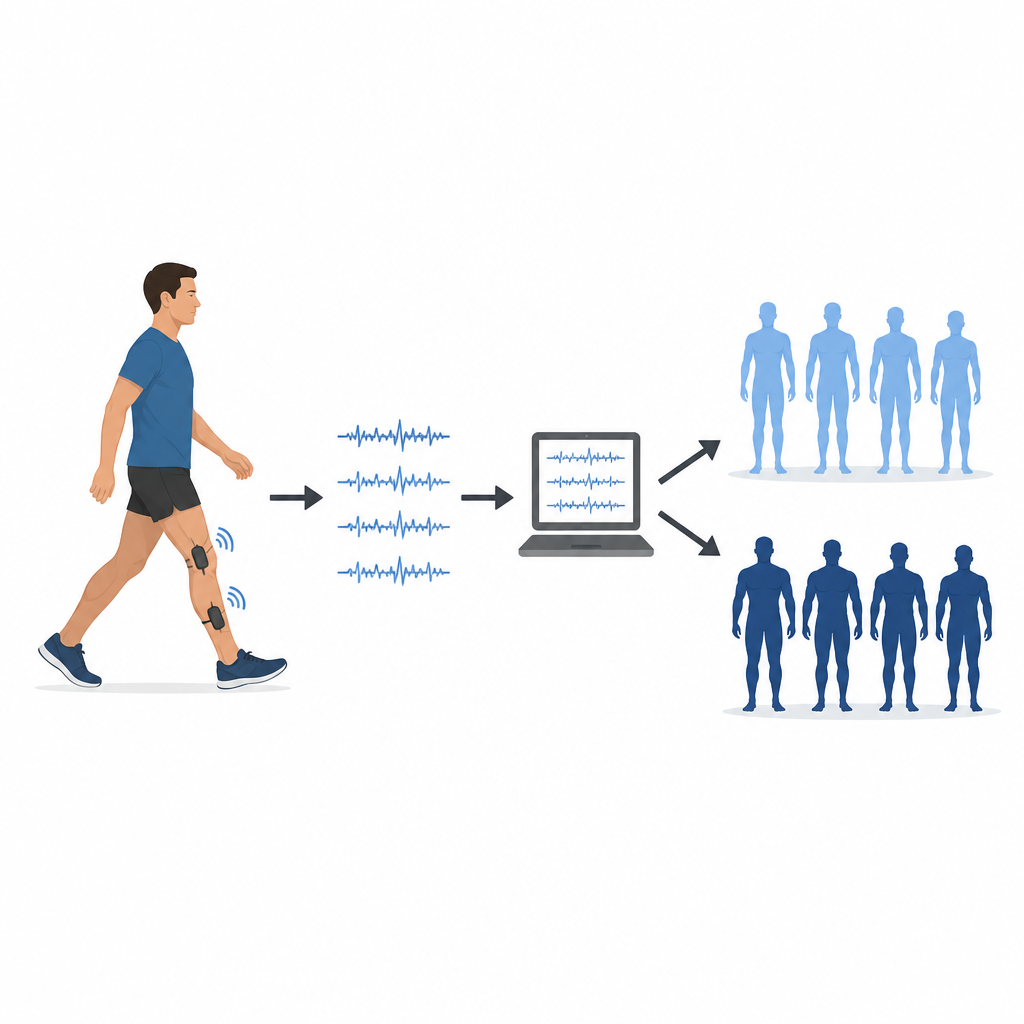
Instead of scanning the whole body, the researchers focused on the tiny electrical signals muscles naturally produce when they contract. These signals, captured at the skin surface using stickers on four key leg muscles, were recorded while 133 adults aged 20 to 59 walked back and forth at both normal and fast speeds. At the same time, motion sensors helped divide each walk into individual steps so the team could examine muscle activity cycle by cycle rather than as one long blur.
Sorting people by muscle size
Participants also completed a standard body composition test that estimates how much muscle is in the arms and legs. Because there are no widely agreed cutoffs for “low muscle” in younger adults, the team used a data‑driven grouping method to place people into three clusters within their sex and age bands, then combined the two higher clusters into a single high‑muscle group. This created a clear low versus high muscle mass label for each person without relying on arbitrary thresholds.
Teaching computers to read muscle signals
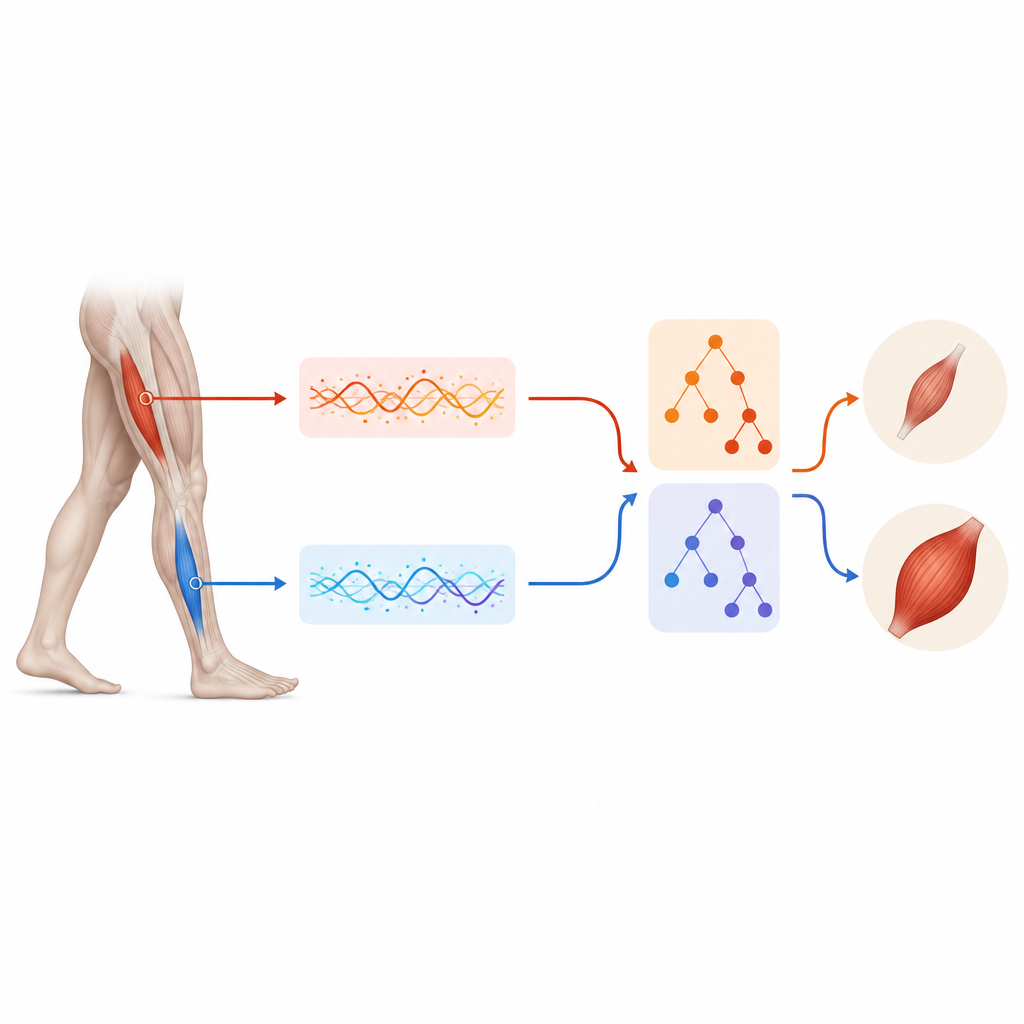
From every recorded step, the researchers extracted hundreds of numerical features that describe how strong, how complex, and how rapidly changing each muscle’s signals were, including subtle patterns revealed by advanced signal processing. They then used several common machine learning models to learn the link between these features and the low‑ or high‑muscle labels. To check that the systems worked for new people, they trained the models on all but one participant and tested them on the person left out, repeating this so that every volunteer served once as the unseen case.
What the models learned about key muscles
The computer models distinguished low from high muscle mass with striking accuracy, about 95 percent during normal walking and 94 percent during fast walking for the best methods. Just as important, the team used an explanation tool to see which features mattered most to the predictions. During everyday‑speed walking, the most informative signal came from the muscle along the front of the shin, where lower peak power was linked to higher overall muscle mass. During fast walking, the most influential feature was how often the electrical signal from a large back‑thigh muscle crossed zero, a measure of its rapid firing pattern, which tended to be higher in people with more muscle.
What this could mean for everyday health
In plain terms, the study shows that how your leg muscles fire while you walk carries a readable signature of how much muscle you have overall. A quick, sensor‑based walking test analyzed by transparent computer methods might one day help flag adults who are drifting toward low muscle mass long before they feel weak or slow. Although larger and more diverse studies are still needed, this work suggests that a short walk across the clinic floor could eventually complement traditional scans as a handy checkup for muscle health.
Citation: Lee, D., Konki, S.K., Jung, D. et al. Discovery of key surface electromyography features during walking for discerning high and low muscle mass using machine learning analysis. Sci Rep 16, 14867 (2026). https://doi.org/10.1038/s41598-026-45053-8
Keywords: muscle mass, surface electromyography, walking analysis, machine learning, sarcopenia risk