Clear Sky Science · en
Explainable AI augmented retailer segmentation using knowledge graph
Why smarter retailer groups matter
When a big brand works with thousands of retail partners, choosing which stores to back most strongly can make or break its profits. This article explores a new way to sort retailers into meaningful groups using a form of artificial intelligence that can also explain how it reached its decisions. That means managers do not just get an answer about which partners are “strategic” or “risky” they also see the reasons behind each call, making it easier to trust the system and act on its advice.
How retailers shape brand success
Retailers are the front line between a brand and its customers. As the example of Nike shows, even when a company pushes direct online sales, a large share of revenue can still flow through independent stores. Brands therefore try to focus their time, credit, and support on a smaller set of high performing retailers. This sorting process, known as retailer segmentation, helps cut costs, sharpen service, and raise sales across the whole network. But getting it right is tricky because performance depends on many factors, from delivery reliability and technology use to financial health and demand planning.
Limits of traditional scorecards
Many firms still rely on simple tools such as portfolio matrices or multi-criteria scorecards to group retailers. These methods may be familiar, but they struggle when criteria become numerous and data grow complex. They often hide the links between different aspects of performance and can force managers to trust scores without understanding the story behind them. The authors review past research showing that grouping detailed checks into broader dimensions like operations, technology, and finance can improve clarity, but they also argue that a more intelligent and transparent approach is now possible with modern AI tools.
Bringing explainable AI and knowledge graphs into play
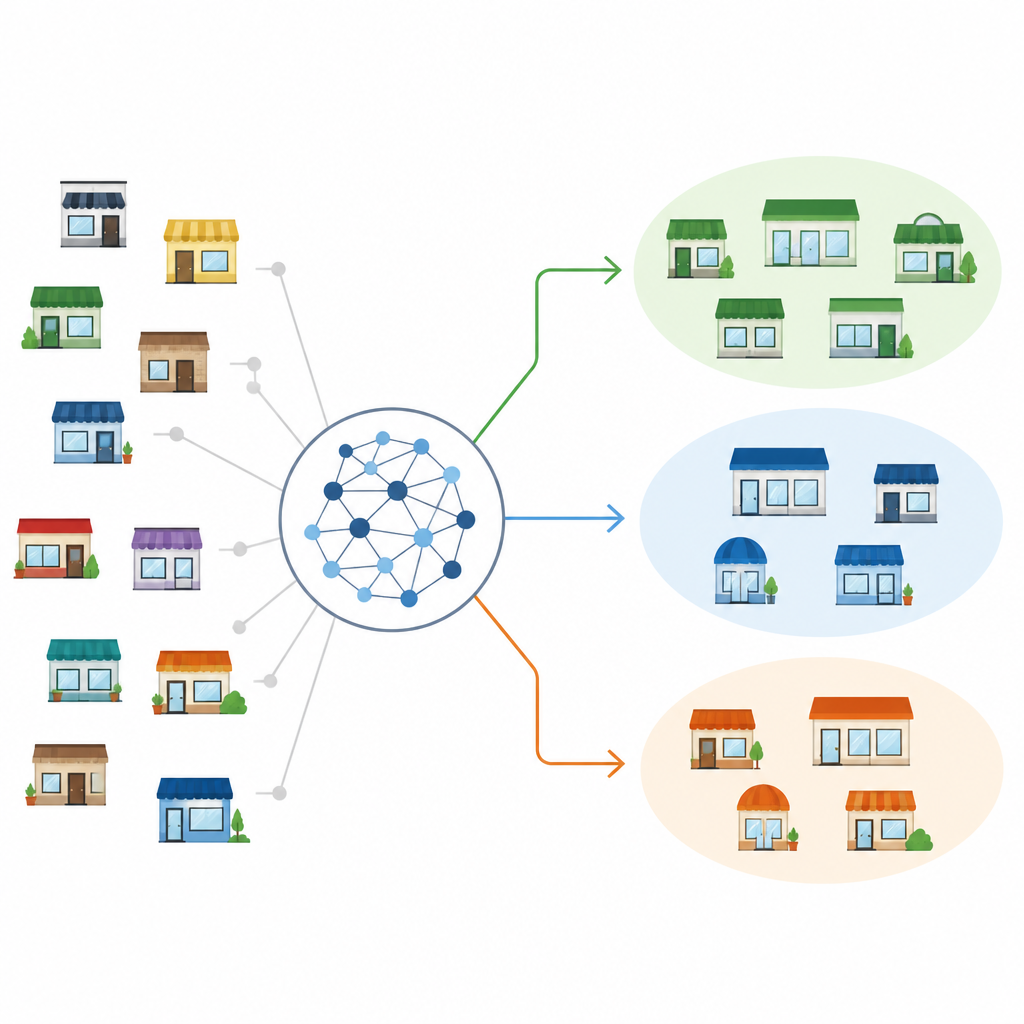
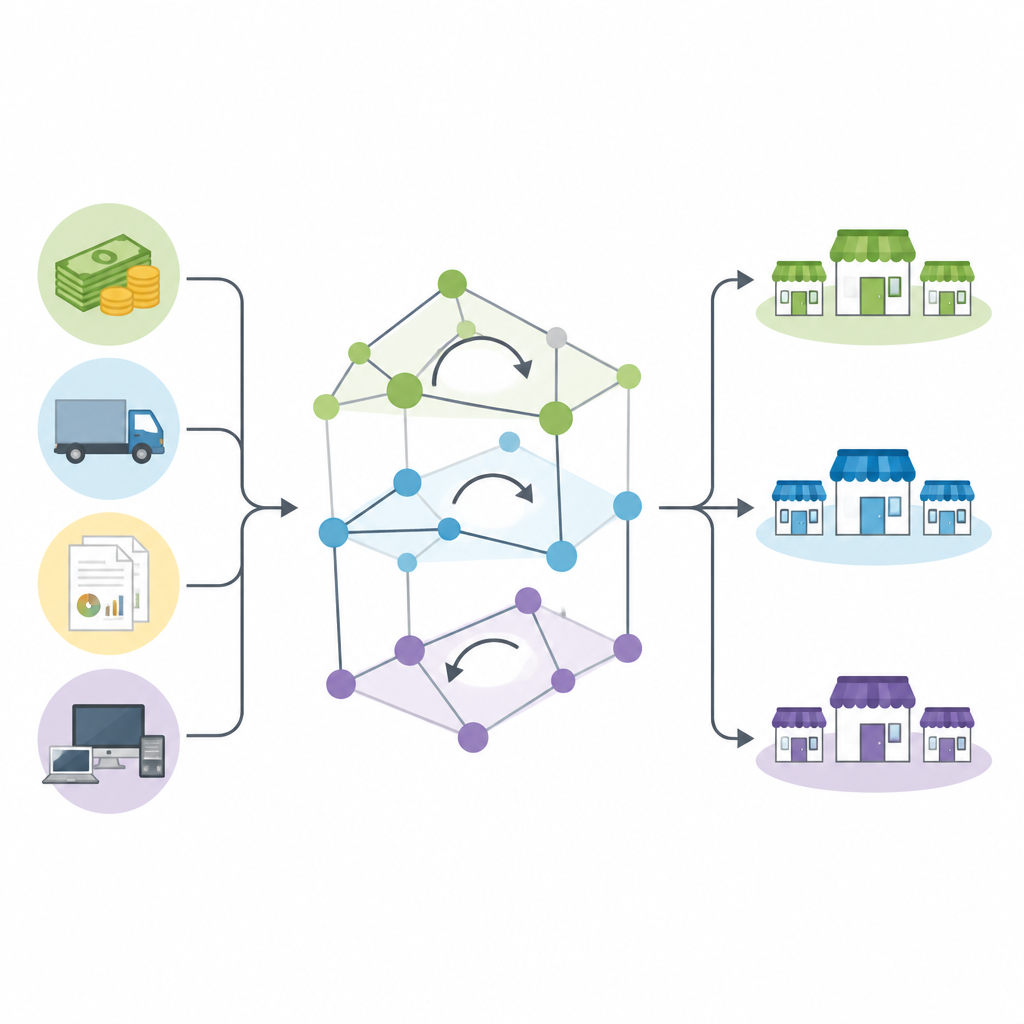
The study introduces a retailer segmentation method built on a knowledge graph, a structured map that links facts about retailers in a way computers can reason over. Expert interviews and prior studies were used to choose key checks, including delivery performance, total cost of ownership, demand management abilities, mode of communication, data handling, and payment risk. Some checks, such as on time delivery and cost, are numeric others, like communication style or data tools used, are qualitative. These are organized into three dimensions: operations, technology, and finance. Real but anonymized data from nineteen retailers feed the graph, capturing both hard figures and expert judgments about each partner.
From raw data to clear retailer categories
Using specialist software, the authors encoded business rules as logical statements inside the graph. For example, a retailer with high returns but manageable risk, strong digital communication, reliable data systems, reasonable costs, solid delivery, and good demand management is treated as a “strategic” partner. Retailers with lower returns but safe behavior and weaker capabilities are classed as “basic,” while those showing poor or negative returns or high risk with high costs and weak delivery fall into a “bottleneck” group. An automated reasoning engine applies these rules to the data and infers which segment each retailer belongs to. Because every decision is tied back to explicit conditions, managers can trace exactly why a given store was labeled in a certain way and check that the result matches their own understanding.
Testing the system’s logic
The authors validate the system by running queries that ask, for example, which retailers count as strategic and then checking whether the underlying data truly meet all the stated conditions. Case examples show how one retailer with high returns, high but acceptable risk, strong digital tools, and good delivery is placed in the strategic segment, while another with negative returns and high costs falls into the bottleneck group. Because the segments are defined with clear, non-overlapping rules in this prototype, no conflicts arise, but the authors note that real-world use might involve more segments and fuzzier boundaries that would require further refinement.
What this means for everyday business choices
In plain terms, the article shows how brands can move from gut feeling and opaque scores to a transparent, data-rich map of their retailer network. By combining many different pieces of information into a single, explainable model, the knowledge graph approach helps decision-makers see not only who their best and riskiest partners are, but also why. While the current study is a simplified proof of concept, it points toward future tools that can handle more criteria and advanced reasoning methods, giving firms clearer guidance on where to invest, where to support improvement, and where to limit exposure.
Citation: Shiralkar, K., Bongale, A., Kumar, S. et al. Explainable AI augmented retailer segmentation using knowledge graph. Sci Rep 16, 15783 (2026). https://doi.org/10.1038/s41598-026-44928-0
Keywords: retailer segmentation, explainable AI, knowledge graph, supply chain, payment risk