Clear Sky Science · en
Spherical fuzzy hypergraph in decision making
Seeing Patterns in Messy Decisions
Online marketplaces, hospitals, and social networks are full of tangled relationships and uncertain information. A product can have glowing praise, lukewarm comments, and harsh complaints all at once, and the same seller may handle many products together. This paper introduces a new mathematical tool, the spherical fuzzy hypergraph, that is designed to make sense of such messy, overlapping situations. It helps turn scattered, conflicting feedback into clear rankings and decisions without pretending that the world is simple or perfectly known.
From Simple Lines to Rich Group Connections
Traditional graphs connect pairs of objects with lines: two friends in a social network, or two cities in a road map. But many real-world situations involve groups rather than pairs. A seller on an e-commerce site influences all of the products in their portfolio at once. A set of doctors might jointly manage a group of treatments for a disease. Hypergraphs extend ordinary graphs by allowing a single "edge" to connect many items together, capturing these group effects in a natural way. This richer structure makes it easier to study how collections of objects behave together, instead of breaking them into many pairwise links that hide the bigger picture.
Capturing Shades of Opinion, Not Just Yes or No
At the same time, real data are rarely black and white. Customer reviews, medical opinions, or sensor readings often fall somewhere between clearly positive and clearly negative, and may even be undecided. Fuzzy set theory was invented to model this in-between status by assigning each item a degree of belonging between zero and one. More recent ideas split opinion into several parts, such as support, doubt, and opposition. The spherical fuzzy model used in this paper records three components for every item: a positive part, a neutral or "abstain" part, and a negative part. These three numbers must fit inside a sphere, which keeps them balanced and stable when many pieces of information are combined.
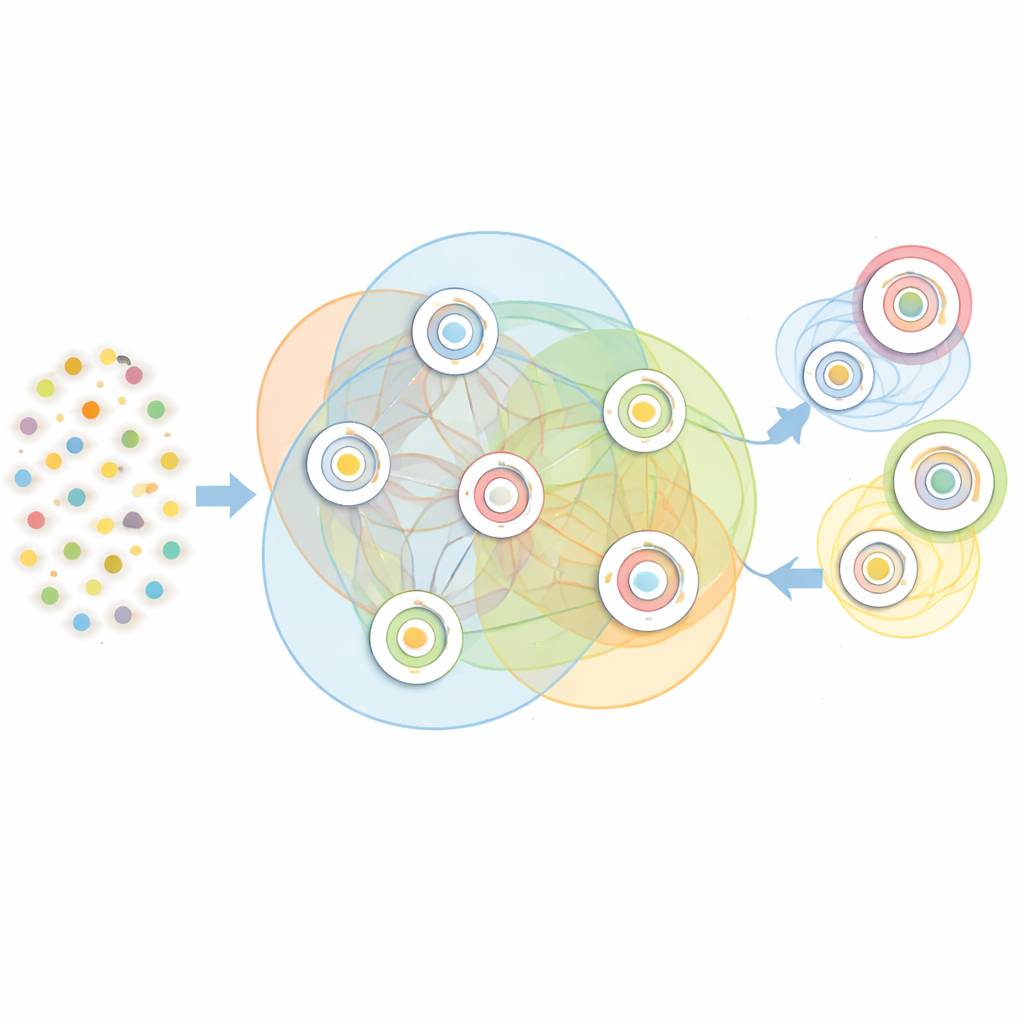
Blending Group Links with Uncertain Evidence
The key step in this work is to marry these two ideas: group-based connections from hypergraphs and three-way, balanced opinions from spherical fuzzy sets. In a spherical fuzzy hypergraph, each object (like a product) is a point in the network, and each group (like all the products sold by one seller) is represented by a special edge that can touch many points at once. Both the objects and the groups carry their own three-part opinion scores, describing how strong the positive, neutral, and negative evidence is. Carefully chosen rules ensure that a group cannot look better than its weakest members and that negative signals from any member are not swept under the rug. This design keeps the model realistic and interpretable: a seller with one badly performing product cannot be judged solely by their best items.
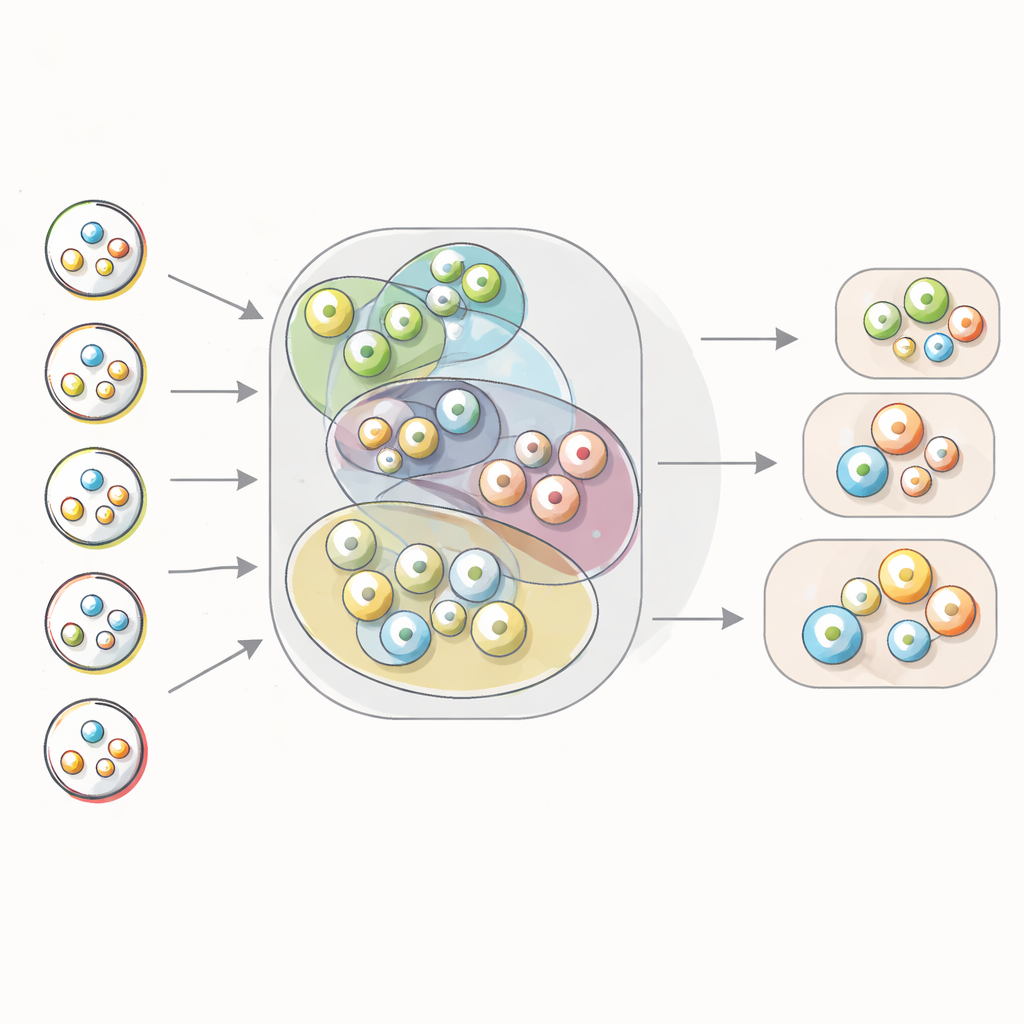
Turning Raw Feedback into Actionable Rankings
To show how this works in practice, the authors build a spherical fuzzy hypergraph for an online shopping platform. Each product receives a triple describing how many reviews are positive, neutral, or negative, adjusted to satisfy the spherical balance condition. Each seller forms a group edge over the products they offer, and the group’s own triple is computed so that it reflects portfolio bottlenecks rather than average performance alone. Simple score and accuracy formulas then convert each triple into two numbers: one summarizing overall satisfaction and another indicating how decisively positive the evidence is. With these measures, the method ranks products, ranks sellers, and even highlights the best product–seller pairs. It also uses network notions like degree and neighborhood to reveal which products sit at the center of many portfolios and which are more isolated.
Why This New View of Networks Matters
When the results from this new approach are compared with a simpler baseline that just averages product scores, important differences appear. Averaging tends to soften bad news, making weak products look better than they should. The spherical fuzzy hypergraph, in contrast, exposes weaknesses at the level of whole groups and shows how a troubled product can drag down a seller’s perceived quality. In the case study, it clearly identifies the strongest product, the most promising product–seller combinations, and the item most in need of attention. Because the method naturally handles many-way relationships and mixed feedback, it promises more trustworthy decisions in any setting where groups of items interact under uncertainty, from e-commerce and social platforms to healthcare, supply chains, and smart cities.
Citation: Pramanik, T., Mahapatra, R., Allahviranloo, T. et al. Spherical fuzzy hypergraph in decision making. Sci Rep 16, 14577 (2026). https://doi.org/10.1038/s41598-026-44917-3
Keywords: fuzzy hypergraph, e-commerce decision making, customer feedback analysis, network modeling, uncertainty in data