Clear Sky Science · en
Visualization and simulation of full-scale point-neuron circuits via the Neural Circuit Visualizer web platform
Bringing Hidden Brain Activity to Your Screen
The activity of millions of brain cells unfolds too quickly and in too small a space for the naked eye to follow. Yet these tangled electrical flashes underlie how we remember a friend’s face or find our way through a new city. This paper presents the Neural Circuit Visualizer (NCV), a free web platform that lets scientists and students simulate and watch large brain circuits come alive in 3D, directly in a browser. By turning massive data into intuitive movies of brain activity, NCV aims to make complex neural dynamics easier to explore, share, and understand.
Why We Need Better Views of the Brain
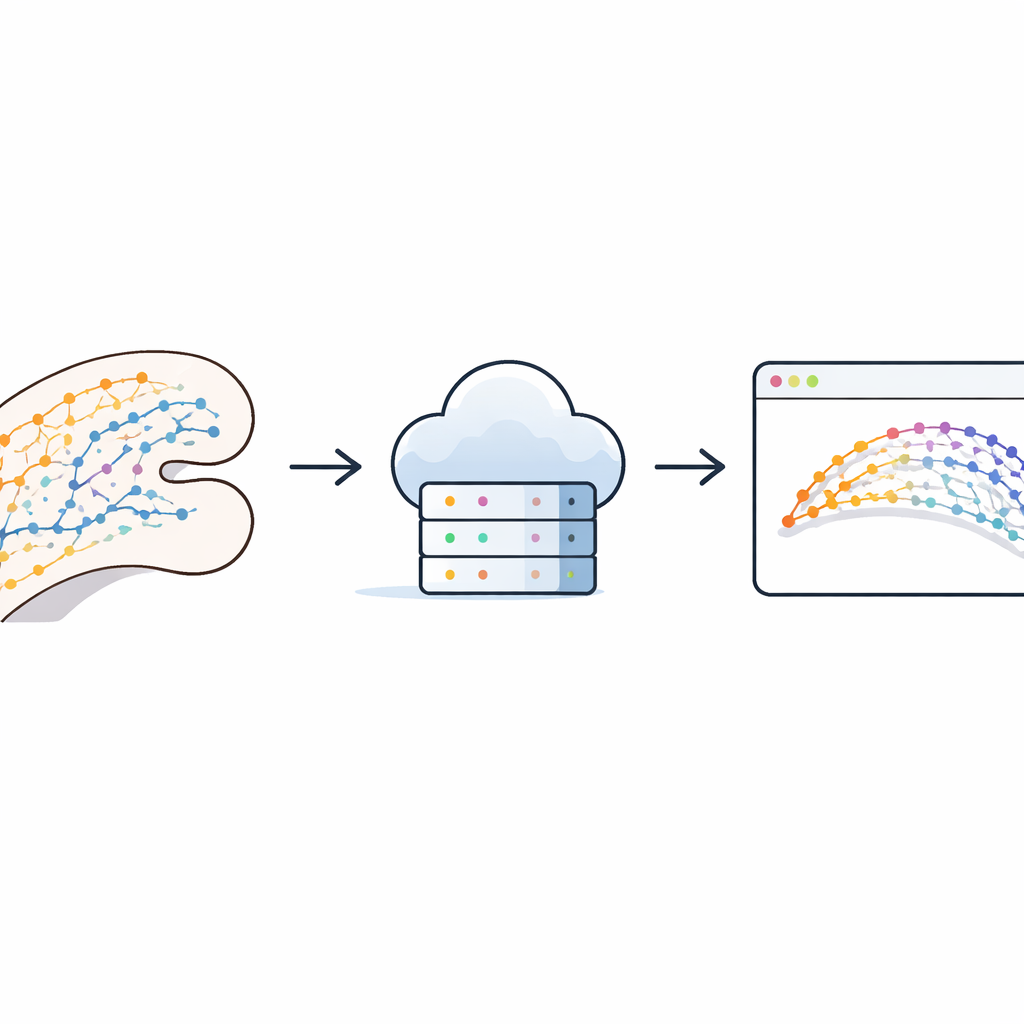
Modern neuroscience can record from and model vast networks of nerve cells, especially in structures like the hippocampus that support learning, memory, and navigation. But most tools either run only on powerful local computers, show static snapshots, or represent the brain as abstract diagrams rather than realistic 3D tissue. As a result, researchers often struggle to see how detailed wiring patterns and cell types work together over time. NCV was created to close this gap: it couples advanced brain models and high‑performance supercomputers to an online, interactive viewer, so that anyone with the right credentials and a web browser can explore realistic circuits, neuron by neuron.
A Web Window into Full‑Scale Brain Circuits
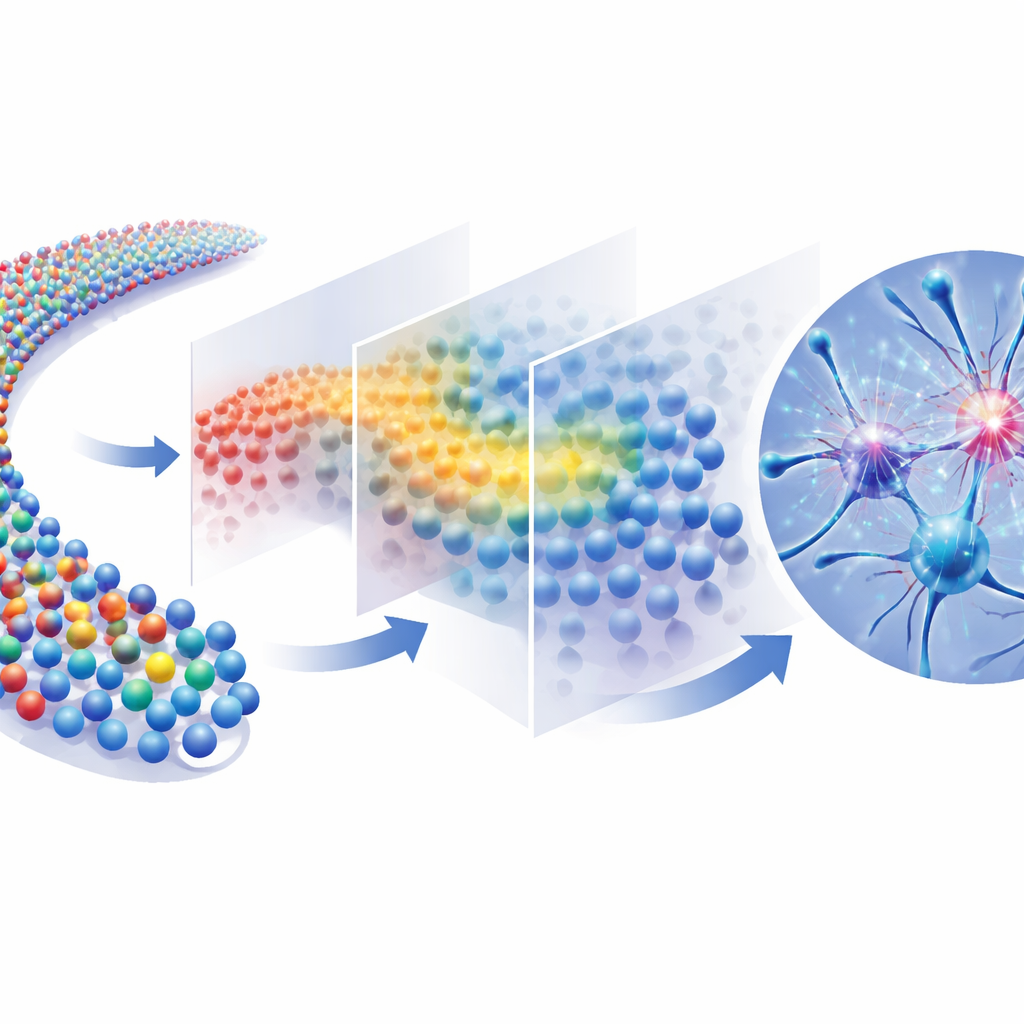
NCV centers on full‑scale models of the hippocampus, focusing first on the CA1 region in the mouse and providing a demonstration model in humans. In these models, hundreds of thousands to millions of cells are placed in 3D according to experimentally measured anatomy, and their electrical pulses are computed on remote supercomputers. The platform then streams the results back to the browser, where each cell appears as a colored sphere in 3D space. Users can play, pause, and scrub through time while watching waves of activity sweep across the curved layers of the hippocampus. Excitatory and inhibitory cells are color‑coded, and active neurons briefly grow and brighten, making it easy to spot patterns such as traveling fronts of activity or localized bursts.
From Raw Data to Interactive Exploration
Behind the scenes, NCV takes care of the heavy lifting that usually demands programming skills. A user can set a few key parameters that control the balance between excitation and inhibition and the strength and frequency of background input, then submit a simulation job without writing any scripts for the supercomputer. Once the job finishes, NCV automatically gathers the results, parses the files, and prepares them for 3D playback. The same interface accepts user‑generated data in common formats, so any lab can upload its own network layouts and spike times, provided the files specify where each cell sits in space and when it fires. The system transparently splits large files into time chunks, keeping playback smooth even for circuits with millions of spikes.
Seeing Specific Pathways and Regions in Action
NCV is not limited to showing the brain as a featureless cloud of points. It comes with rich, pre‑integrated reconstructions of the full mouse hippocampal formation—covering dentate gyrus, CA3, CA2, CA1, subiculum, and entorhinal cortex—based on community databases of known cell types and their locations. Users can toggle entire regions, layers, or individual neuron classes on and off to focus on specific structures, and they can explore specially built connection patterns such as the classic projection from CA3 to CA1. In this pathway, NCV uses biologically grounded rules so that nearby cells connect more often but the overall wiring remains sparse, as in real tissue. Watching simulated activity travel from CA3 into CA1 reveals how local firing in one subregion can produce orderly, time‑locked patterns elsewhere.
Built for Today’s and Tomorrow’s Brain Research
The authors show that NCV scales to networks of up to several million neurons while remaining responsive in a standard browser, thanks to a carefully designed software architecture that combines web graphics, secure servers, and high‑performance computing resources across European research infrastructures. The platform already serves as a teaching tool, a way to sanity‑check new models, and a bridge between different simulation packages that produce compatible output files. Looking ahead, the team plans to add richer analysis tools and more flexible stimulation options, so that users can probe how circuits respond to targeted inputs or exhibit complex rhythms. In plain terms, NCV turns abstract brain simulations into something you can watch and manipulate, helping scientists and learners alike build an intuitive sense of how structure and activity in the hippocampus give rise to memory, navigation, and their breakdown in disease.
Citation: Ali, M., Smiriglia, R., Spera, E. et al. Visualization and simulation of full-scale point-neuron circuits via the Neural Circuit Visualizer web platform. Sci Rep 16, 14345 (2026). https://doi.org/10.1038/s41598-026-44588-0
Keywords: hippocampus, neural circuits, brain simulation, data visualization, high performance computing