Clear Sky Science · en
A retrospective clinical risk prediction model for co‑infection with Mycoplasma pneumoniae in patients with COVID‑19 based on restricted cubic splines
Why hidden lung infections matter
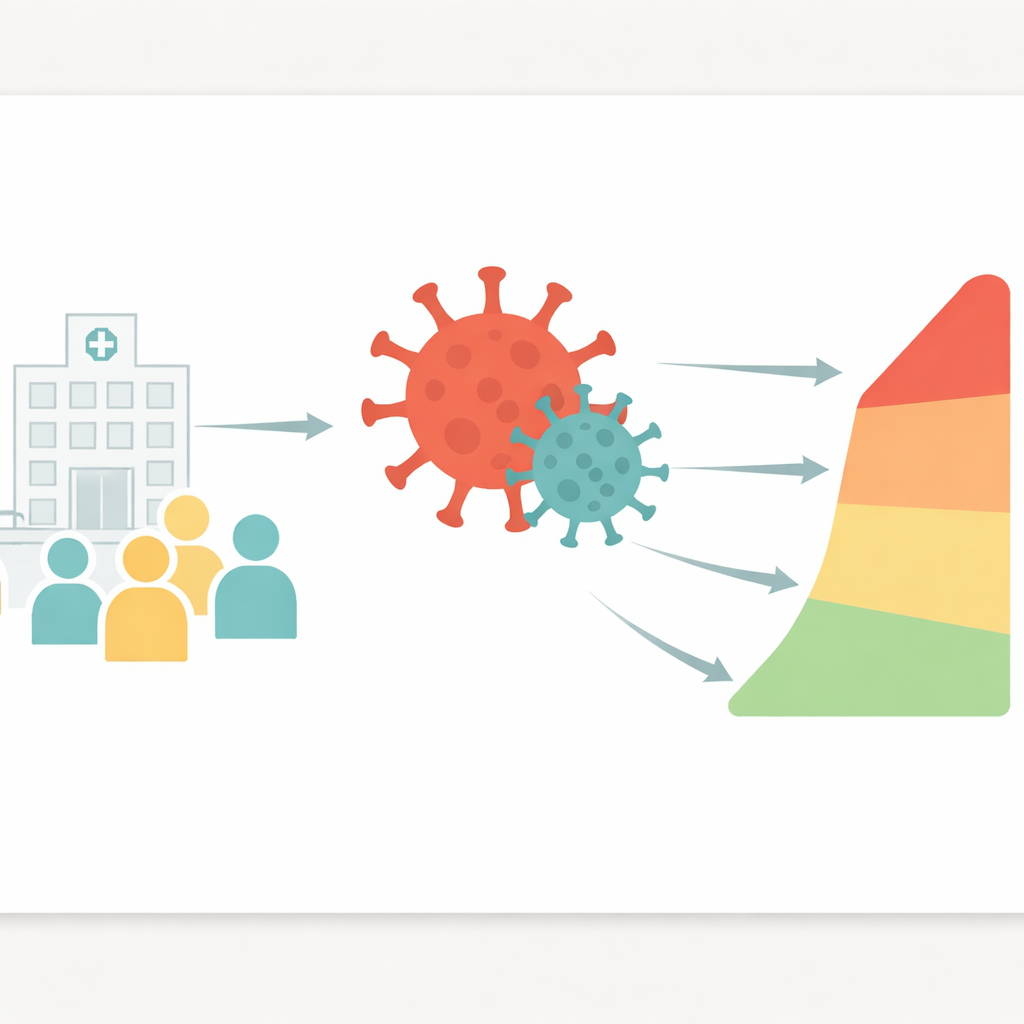
Most people now think of COVID-19 as a familiar illness, but for some patients it still turns life-threatening, especially when another germ quietly joins in. One common partner is Mycoplasma pneumoniae, a tiny bacterium that also causes pneumonia. Because its symptoms and lung scans can look very similar to COVID-19, this extra infection is easy to miss. The study behind this article set out to build a practical hospital tool that can flag which COVID-19 patients are likely to carry this hidden co‑infection, using only routine blood tests taken at admission.
Two infections that look alike but act worse together
Doctors have learned that when COVID-19 and Mycoplasma pneumoniae strike the same person, outcomes are often worse. These patients tend to stay in the hospital longer, need breathing machines more often, and are more likely to die than those with COVID-19 alone. Yet chest CT scans and everyday symptoms do not reliably distinguish the combined infection from the virus by itself. Treating everyone “just in case” with extra antibiotics is not the answer either, because it fuels drug resistance and unnecessary side effects. What clinicians need is a way to pick out, early on, which patients are most likely to harbor both germs so that testing and treatment can be targeted rather than blanket.
Turning routine lab tests into an early warning score
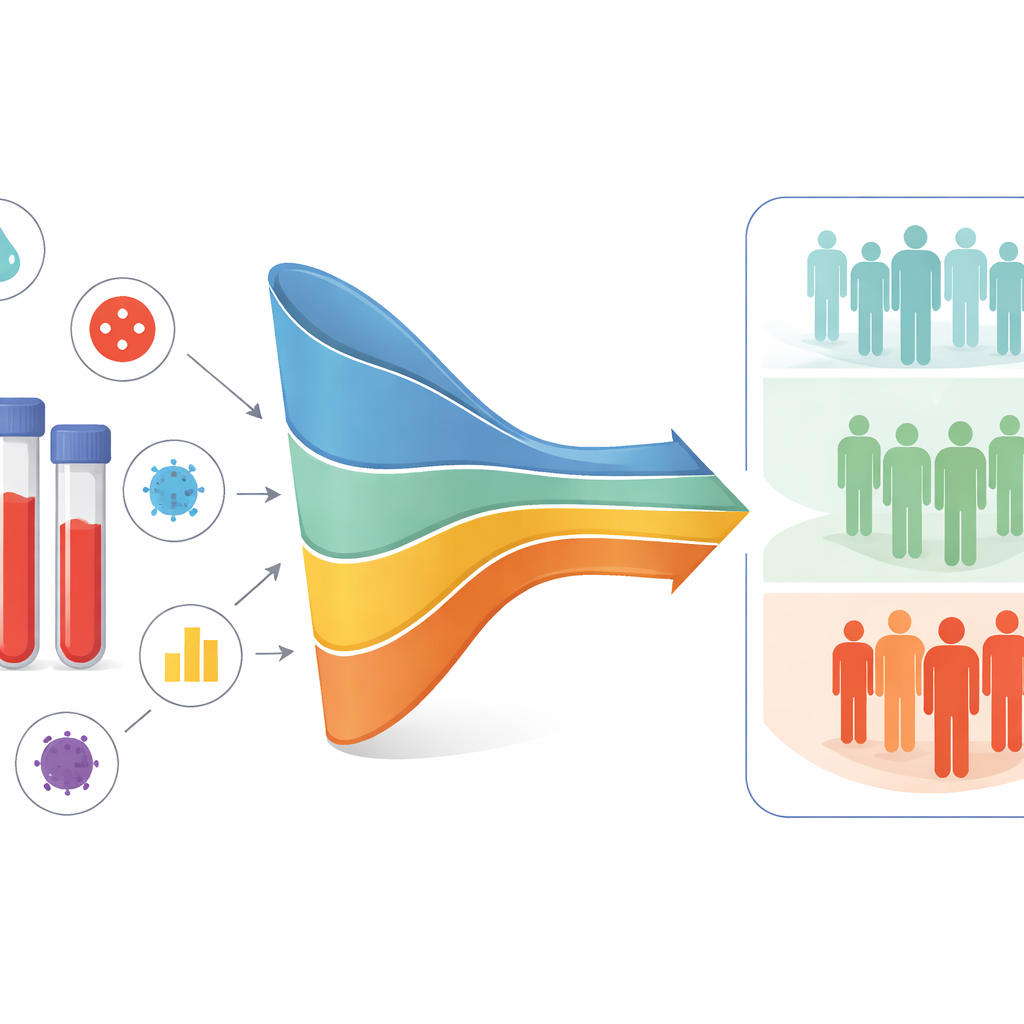
The researchers looked back at 242 adults hospitalized with COVID-19 in one Chinese hospital during the first big Omicron wave in late 2022 and early 2023. All had signs of pneumonia, and blood was tested for antibodies against Mycoplasma pneumoniae. About half turned out to have both infections. From 55 pieces of information routinely collected at admission—such as age, common blood counts, basic chemistry, and clotting tests—they used a statistical technique called LASSO to sift out the few most informative factors. Seven stood out: age; globulin (a group of blood proteins that includes antibodies); anion gap (a marker related to the body’s acid–base balance); blood urea nitrogen (a waste product that reflects kidney and liver function, and nutrition); uric acid (a natural antioxidant); and two clotting measures, prothrombin time and thrombin time.
Patterns in the blood that signal extra trouble
When the team examined how these seven factors related to the chance of co‑infection, a picture of disturbed immunity, clotting, and metabolism emerged. Higher globulin, anion gap, uric acid, and longer thrombin time were linked to greater risk of Mycoplasma on top of COVID-19, while higher blood urea nitrogen was unexpectedly linked to lower risk. Some relationships were not simple straight lines: for example, the risk rose sharply once globulin nudged above about 28 grams per liter, and patients with particularly short prothrombin times appeared to be in a heightened clot‑forming state. These twists and thresholds are exactly what standard linear models often miss but may matter at a bedside, where crossing a certain lab value could mark a shift from routine illness to something more dangerous.
A smarter way to follow curved risk
To capture these curved relationships, the authors built a prediction model that lets the risk curve bend where the data demand it, using an approach called restricted cubic splines within a logistic regression. In practice, this means the model can treat globulin, prothrombin time, and thrombin time as having different effects at low, medium, and high levels, instead of forcing a single straight‑line rule. Compared with a conventional linear model using the same seven inputs, the spline‑based version separated co‑infected from non‑co‑infected patients more accurately and more usefully for decision‑making. It showed a higher ability to distinguish cases, better agreement between predicted and observed risks, and a greater net clinical benefit across a realistic range of thresholds where a doctor might decide to order extra tests or start antibiotics.
From research chart to bedside tool
To make this approach usable in busy wards, the team translated the mathematics into a visual score chart called a nomogram: a doctor can line up a patient’s age and lab values on simple scales, add up points, and read off an estimated probability of Mycoplasma co‑infection. Because all required measurements come from routine admission tests, the model could, in principle, be applied without any new equipment. The study has limits—it was done at a single center over a short time, without external validation or a separate group of patients who had Mycoplasma alone—but it offers an important proof of concept. For front‑line clinicians facing new waves of COVID‑19 or future respiratory outbreaks, it shows that subtle patterns in ordinary blood work can be harnessed to uncover hidden co‑infections early, helping them direct testing, tailor antibiotics, and potentially improve outcomes while avoiding unnecessary treatment.
Citation: Ye, K., Su, Y., Hu, X. et al. A retrospective clinical risk prediction model for co‑infection with Mycoplasma pneumoniae in patients with COVID‑19 based on restricted cubic splines. Sci Rep 16, 14206 (2026). https://doi.org/10.1038/s41598-026-44539-9
Keywords: COVID-19 co-infection, Mycoplasma pneumoniae, clinical risk prediction, hospital pneumonia, blood biomarkers