Clear Sky Science · en
A social media driven model for evaluating coupled flood damage and resilience at a fine scale
Why this story of floods and phones matters
As cities face heavier downpours under climate change, planners urgently need to know not just where floods hit hardest, but also which neighborhoods bounce back quickest. This study follows the catastrophic July 2021 rainstorm in Zhengzhou, China, and shows how social media posts—people asking for help, sharing photos, or expressing fear—can be turned into detailed maps of both flood damage and resilience. The work reveals why some districts with strong services still suffer badly, while other areas escape the worst, and offers a roadmap for smarter, street‑level flood planning in cities worldwide.
From rain on streets to signals on screens
The researchers began by rethinking how we measure flood impacts. Traditional approaches rely on coarse statistics like insurance claims or government reports, which blur differences between blocks and neighborhoods. Here, the team harvested over eight thousand messages from multiple online platforms, including Weibo and crowdsourced rescue documents, during and after the Zhengzhou storm. Using location tags and text analysis, they built two kinds of damage indicators: physical damage, based on where people were seeking and offering material help, and psychological damage, inferred from the emotional tone of posts describing panic, loss, or relief. These signals were mapped onto a one‑kilometer grid covering the city center, producing fine‑scale patterns of how hard each area was hit. 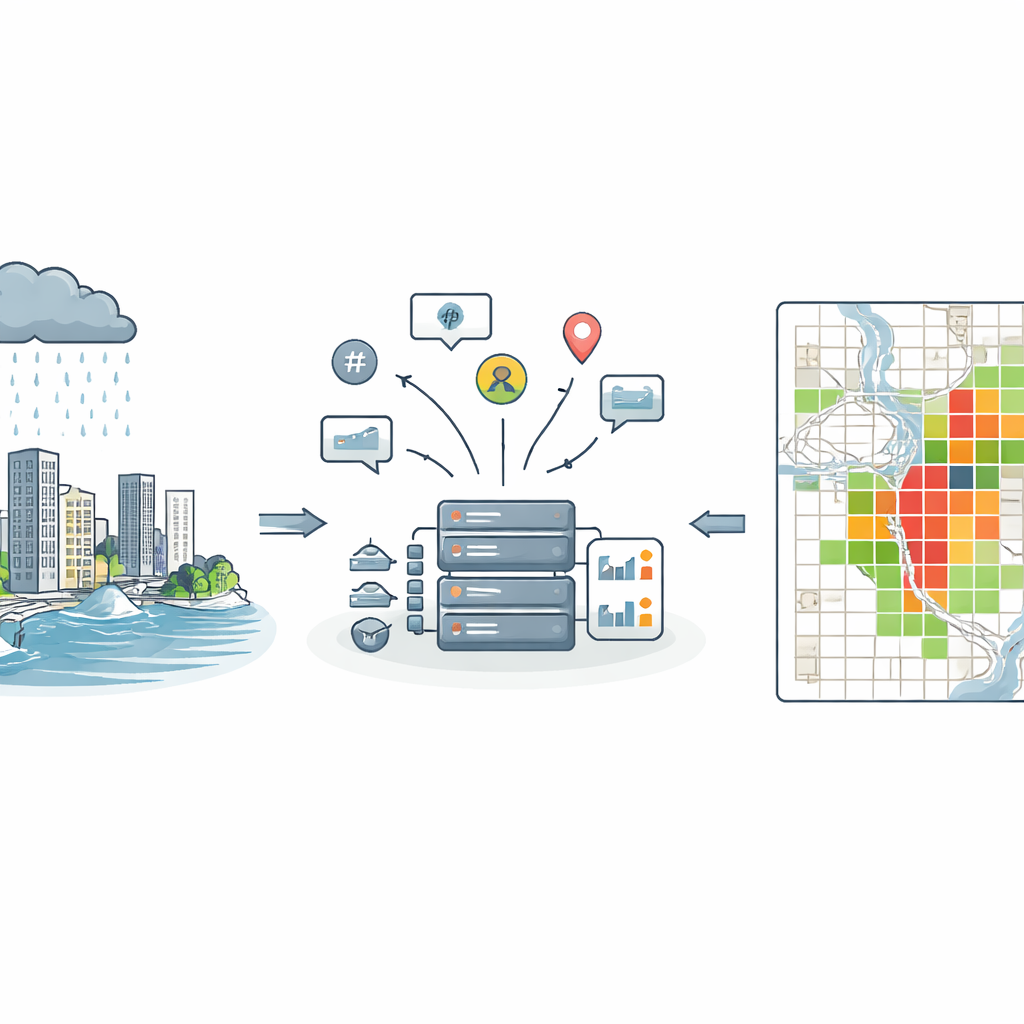
Seeing the city as a web of strengths and weak spots
Damage is only half the story; the other half is resilience—the ability to cope and recover. The team assembled a broad set of clues about resilience for each grid cell. These included environmental conditions (such as green space and distance from rivers), social and economic context (population density, age structure, housing prices), and, crucially, the presence and accessibility of services like fire stations, hospitals, roads, public facilities, and shelters. They distinguished “baseline” resilience, rooted in long‑standing features like infrastructure and institutions, from “adaptive” resilience, captured by where volunteer efforts, temporary shelters, and social‑media‑driven “social rescue” activity were concentrated. Together, these layers painted a multidimensional portrait of how prepared, connected, and responsive each part of the city was when the storm struck.
Matching online distress to real‑world flooding
To ensure that social media really reflected physical flooding, the authors compared the density of damage‑related posts with satellite‑based maps of inundation combined with population density. The match was strong: places with more water on the ground and more people living there also showed higher volumes of distress messages. They then used a machine‑learning approach—a stepwise clustering model—combined with a technique called hierarchical partitioning to untangle which resilience factors most shaped the observed damage. Accessibility to fire stations emerged as the single most important influence, followed by proximity to medical facilities, the structure of the road network, population density, and the density of public services. Surprisingly, vegetation and other natural features contributed relatively little under this extreme cloudburst, when sheer water volume overwhelmed the land’s ability to soak it up.
A city divided into five kinds of risk
Next, the team examined how well resilience and damage “fit together” using a coupling‑coordination measure. This allowed them to sort the city into five types of areas, from high damage with weak resilience on the urban fringe to densely built‑up cores with strong services but still heavy losses. Outlying suburban villages (Category A) had relatively good natural conditions but poor access to emergency services and few public facilities, leaving residents exposed when flooding occurred. New resettlement zones and industrial belts (Category B) combined high risk with thin social ties and underdeveloped services. Older inner‑ring neighborhoods and university districts (Categories C and D) fared better thanks to stronger institutions, dense networks of roads and services, and close‑knit communities. The busy city center (Category E) showed high resilience but also very high damage, as its concentration of people and activity outstripped the capacity of even well‑equipped systems. 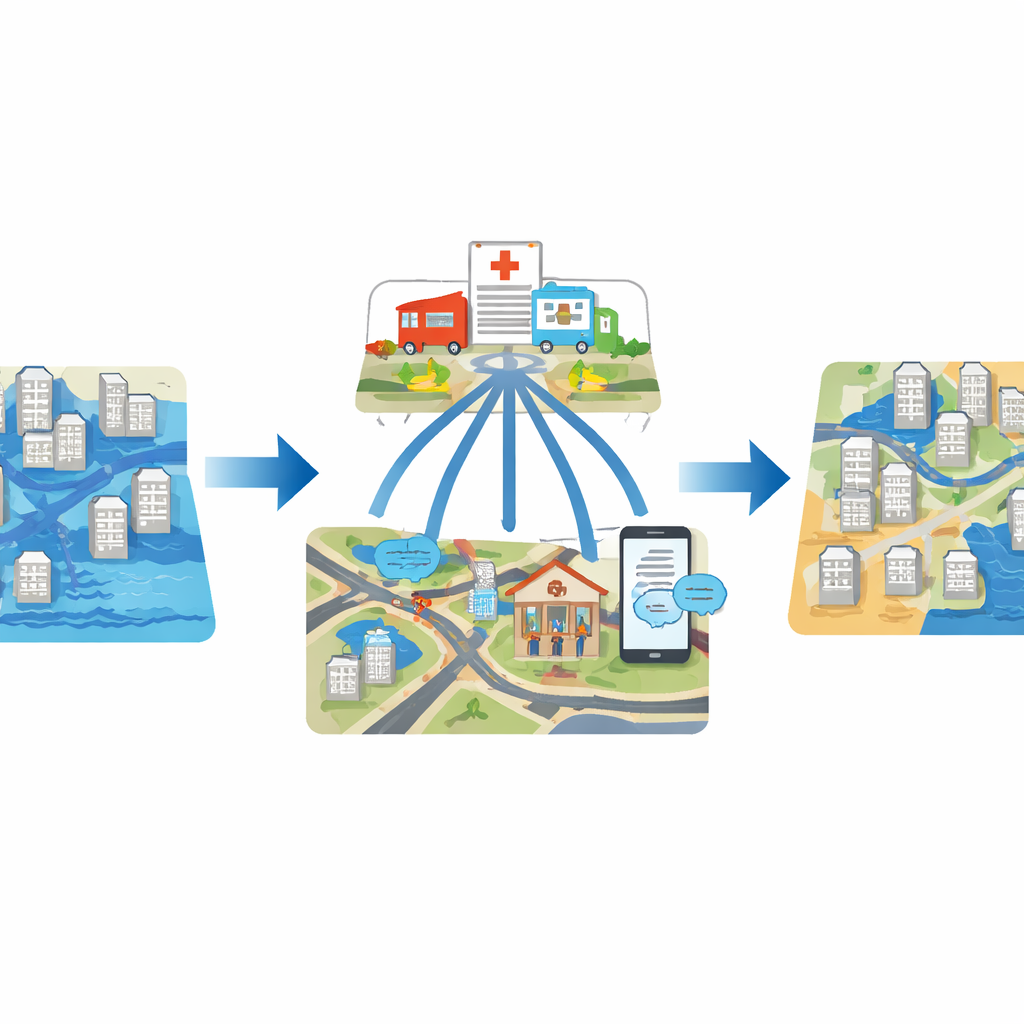
Turning insights into targeted action
Drawing on these patterns, the authors sketched tailored strategies for different urban situations. In isolated suburban areas, they recommend extending emergency routes and communication coverage. New housing districts and industrial fringes need local mutual‑aid groups, neighborhood‑level depots for supplies, and better everyday services to build social ties before disasters strike. Intermediate urban rings could benefit from more permeable surfaces and restored buffers along rivers to manage runoff. Older central neighborhoods and campus areas can use their strong community bonds by designating schools and public buildings as shared shelters. In high‑density downtown cores, adding small parks and open spaces that double as drainage and gathering points can help relieve pressure on overstretched systems.
What this means for future flood‑ready cities
In plain terms, this study shows that what saves lives and reduces suffering in urban floods is not just where the water goes, but how quickly help can reach people and how strongly neighbors can mobilize. By weaving together social media signals, maps of physical flooding, and a rich set of urban features, the authors create a practical framework that cities with active online communities can adapt. Their key message is that investments in emergency services, road access, and community support networks are just as vital as drains and dikes—and that with the right tools, the digital traces of crisis can guide very concrete, block‑by‑block improvements in flood resilience.
Citation: Sun, D., Mi, X., Zhang, Z. et al. A social media driven model for evaluating coupled flood damage and resilience at a fine scale. Sci Rep 16, 14451 (2026). https://doi.org/10.1038/s41598-026-44294-x
Keywords: urban flood resilience, social media data, disaster risk mapping, emergency services access, climate change adaptation