Clear Sky Science · en
Value of hyperspectral data for wall to wall wetland vegetation mapping in heterogeneous landscapes
Why mapping watery landscapes matters
Wetlands are some of the planet’s most productive and threatened ecosystems. They store carbon, buffer floods, and shelter rare plants and animals—but they are also hard to reach and even harder to map in detail on foot. This study asks a practical question that park managers and conservationists everywhere face: do we really need expensive, cutting-edge hyperspectral flights to understand wetland vegetation, or can cheaper, more common aerial images do the job well enough?
Peering down on a maze of marshes
The researchers focused on Narew National Park in northeastern Poland, one of Europe’s largest floodplain wetland complexes. Here, a branching, multi‑channel river winds through a flat valley packed with reed beds, sedge marshes, wet meadows, lowland fens, willow thickets, and riparian forests. Many areas are difficult or impossible to access on the ground, yet the vegetation is changing as traditional farming fades and water levels drop. To track these shifts, the team combined field botany with aircraft‑borne remote sensing over more than 300 square kilometres.
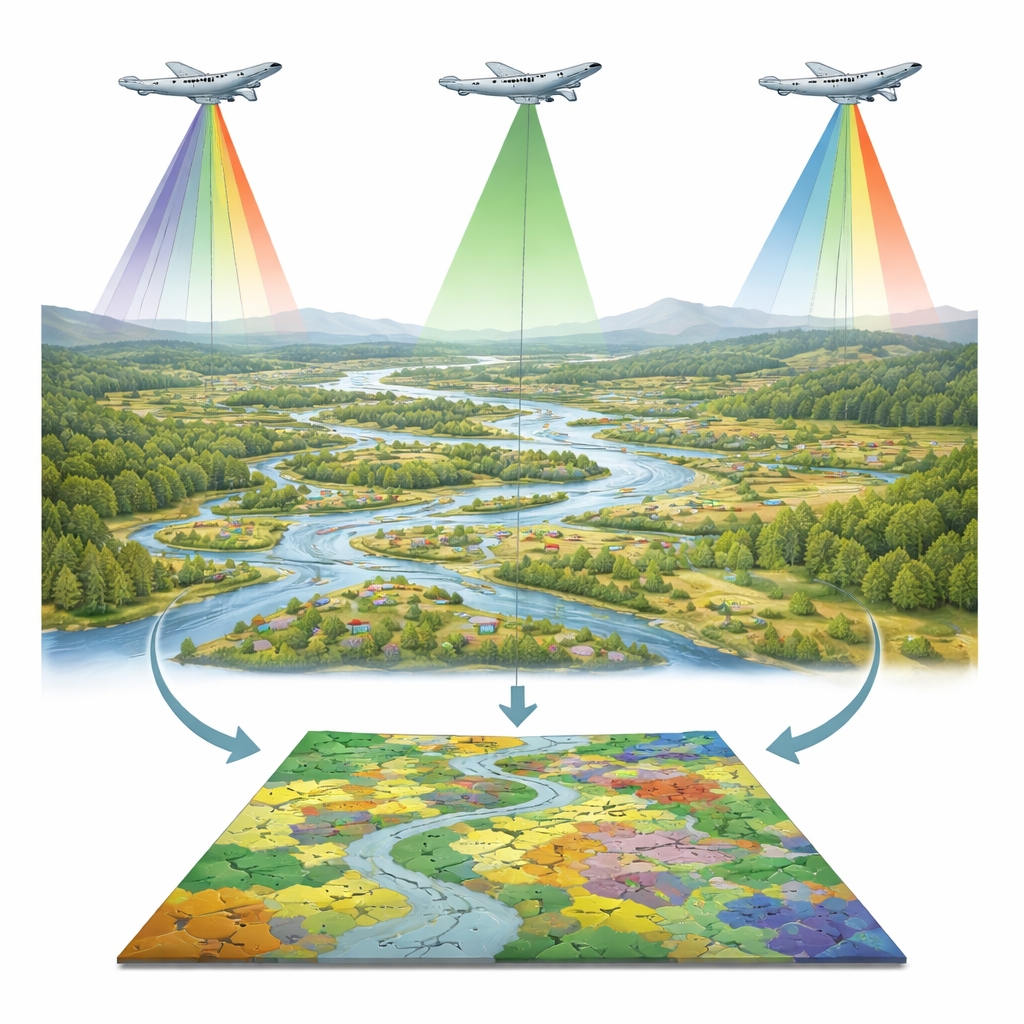
Airplanes, lasers, and many colors of light
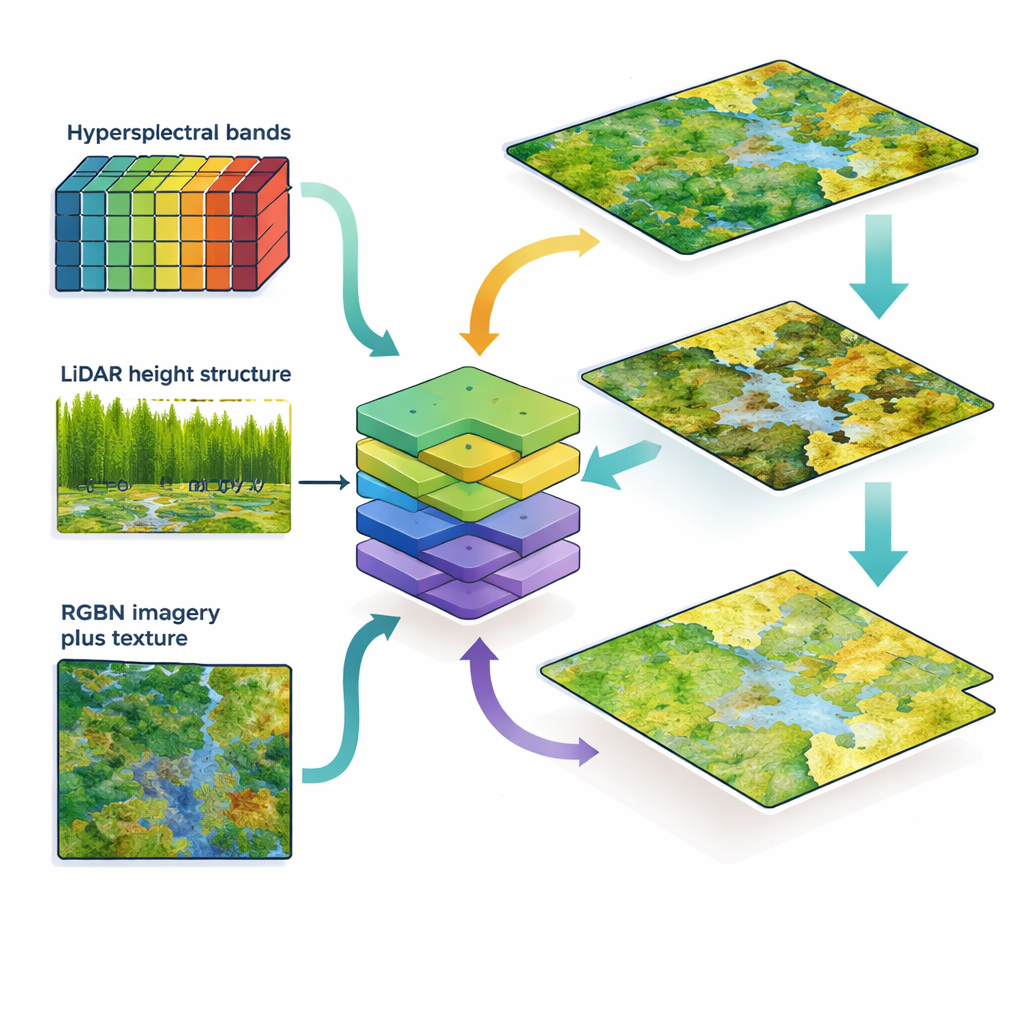
In the summer of 2020, planes collected three kinds of data over the park. Hyperspectral sensors recorded hundreds of very narrow color bands from visible to short‑wave infrared light, capturing subtle differences in leaf chemistry and moisture. A LiDAR scanner fired laser pulses to measure the three‑dimensional structure of vegetation, such as height and canopy complexity. A high‑resolution RGBN camera captured familiar red, green, blue, and near‑infrared images at 10‑centimeter detail, from which the team also computed a vegetation index and fine‑scale texture measures that describe how pixel tones vary in small neighborhoods. On the ground, botanists mapped nearly 2,000 reference plots, distinguishing 30 detailed vegetation classes that range from open water to specific marsh and forest communities.
Teaching a computer to recognize plant patterns
The scientists then trained a machine‑learning model (CatBoost) to predict vegetation type for every square meter, testing four data combinations. The most information‑rich set joined hyperspectral data with LiDAR; a second used only LiDAR; a third fused LiDAR with RGBN images; and a fourth added texture layers to that RGBN‑LiDAR mix. By repeatedly training and validating the model on different subsets of the field plots, they assessed how often it correctly identified each class. They also compared how similar the resulting maps were to each other and to an existing hand‑drawn vegetation map of the park, using both visual inspection and a standard overlap index.
What is gained and lost without hyperspectral data
The combined hyperspectral‑plus‑LiDAR dataset clearly performed best, correctly classifying about 82 percent of locations overall and giving strong results for many individual communities, especially forests, marsh reeds, and willow stands. Using LiDAR alone dropped accuracy to about 63 percent, which the authors judge too low for conservation decisions. Replacing hyperspectral data with RGBN images improved matters substantially compared with LiDAR alone: accuracy climbed to about 72–73 percent, with the added texture layers providing only a small extra boost. For some vegetation types—such as open‑water plants, certain reeds, and lowland fens—the RGBN‑plus‑texture approach came close to the performance of hyperspectral data. For others, particularly tall‑herb communities and some sedge swamps and shrub types, losing hyperspectral detail caused marked drops in reliability.
Seeing more than field maps alone can show
When the new remote sensing maps were set against the traditional field‑based vegetation map used in the park’s management plan, the differences were striking. The airborne data revealed many small but ecologically important patches—such as meadows on tiny mineral hummocks and fragments of rare fen vegetation—that the field map had missed or generalized into broad units. Remote sensing also captured complex mosaics where different marsh communities interweave across the floodplain. At the same time, some fine‑grained grassland types identified by botanists remained hard to separate from imagery alone, underlining the continuing value of expert field work.
What this means for protecting wetlands
For managers of protected wetlands, the study delivers a nuanced message. If budgets allow, combining hyperspectral and LiDAR data offers the most accurate wall‑to‑wall maps and best supports detailed habitat management. However, where such advanced flights are too costly, fusing more affordable RGBN imagery with LiDAR still yields useful, reasonably accurate maps for many vegetation types, especially when enhanced with texture information. Above all, the work shows that airborne remote sensing—whether top‑tier or more modest—can greatly enrich and complement traditional field mapping, revealing the fine patchwork of wetland vegetation that underpins biodiversity and guides smarter conservation decisions.
Citation: Jarocińska, A., Kopeć, D., Niedzielko, J. et al. Value of hyperspectral data for wall to wall wetland vegetation mapping in heterogeneous landscapes. Sci Rep 16, 13947 (2026). https://doi.org/10.1038/s41598-026-44275-0
Keywords: wetland mapping, remote sensing, hyperspectral imaging, LiDAR, vegetation classification