Clear Sky Science · en
Spatiotemporal evolution and spatial differentiation of carbon emission intensity in the Chinese transport sector
Why this research matters to everyday life
Transportation keeps people and goods moving, but it also produces a large share of climate‑warming carbon dioxide. China, the world’s biggest carbon emitter, has promised to peak its emissions before 2030 and reach carbon neutrality by 2060. This study looks closely at how “carbon emission intensity” of transport—that is, emissions per unit of economic output from transport—has changed across China’s provinces over time. Understanding where emissions are falling quickly, where they remain stubbornly high, and how neighboring regions influence each other can help design smarter, fairer policies that clean up transport without slowing development.
Tracking a nation on the move
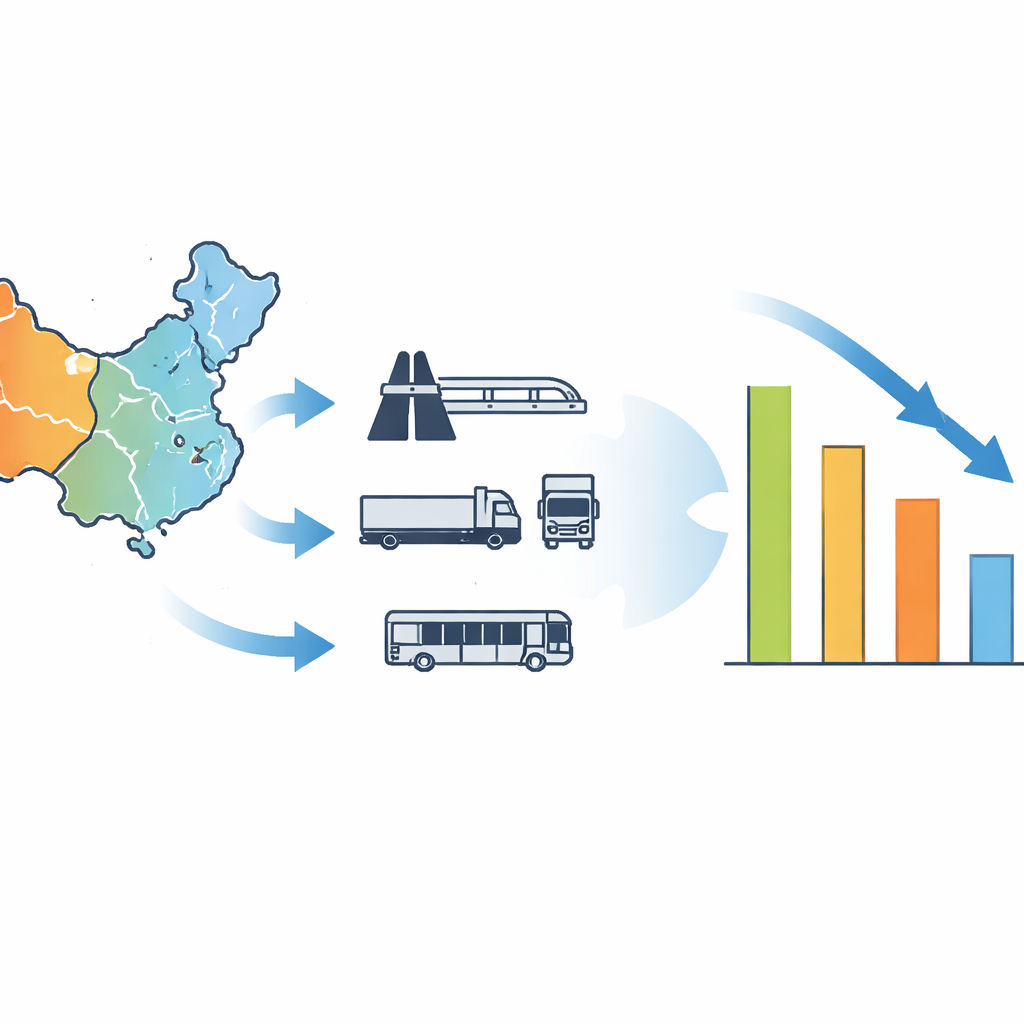
The authors first estimate carbon emission intensity for the transport sector in 30 Chinese provinces between 2005 and 2022 using an approach recommended by the Intergovernmental Panel on Climate Change. They combine data on different fuels, such as coal, gasoline, diesel, and electricity, with the economic value created by transport. The headline finding is encouraging: across the country, transport’s carbon intensity has dropped by more than half, from about 3.15 to 1.25 tons of carbon dioxide for every 10,000 yuan of transport value. This indicates big gains in fuel efficiency, cleaner vehicles, and better technology, and means that transport has actually outperformed China’s national target for cutting emissions per unit of GDP.
Uneven progress across regions
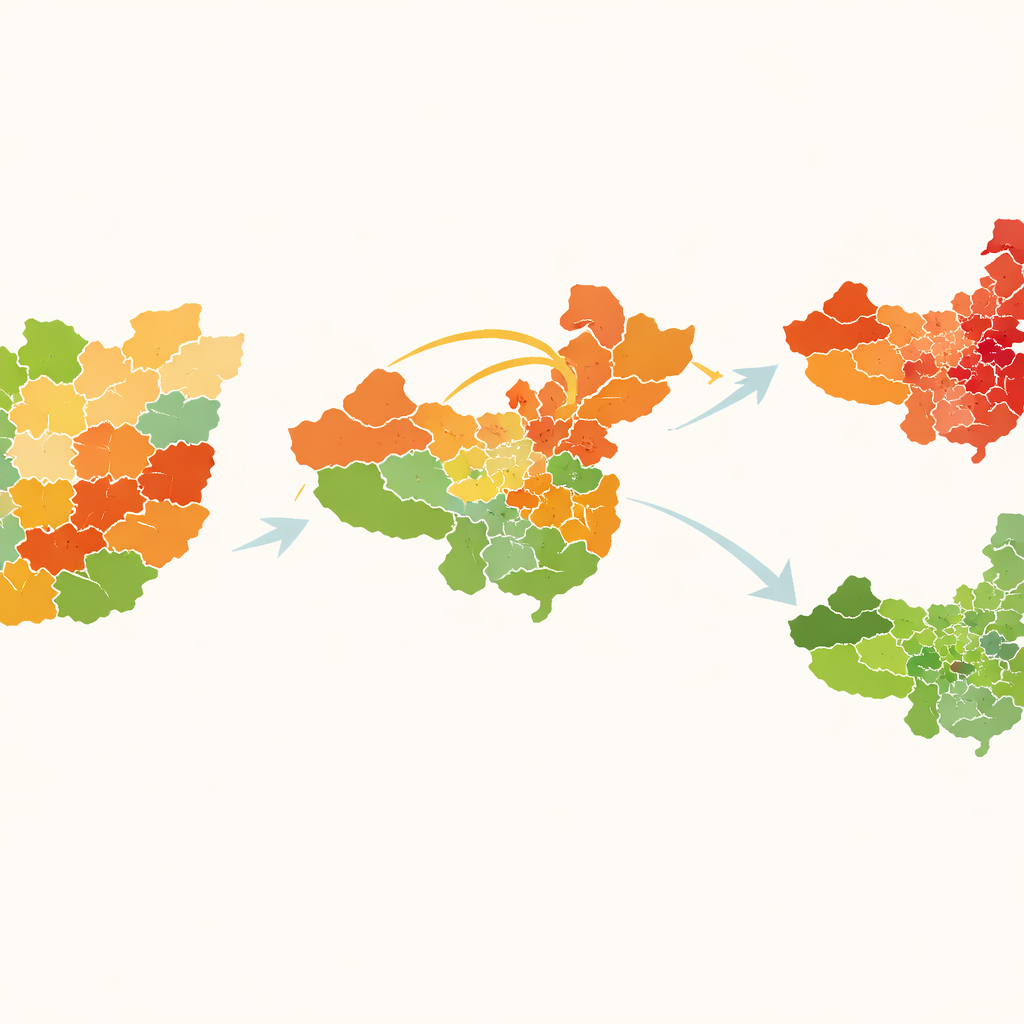
Behind this national success, however, lies a patchwork of regional differences. The authors group provinces into eastern, central, and western regions. All three have reduced carbon intensity, but not at the same pace. The eastern region, home to many coastal economic powerhouses, shows the fastest decline thanks to quicker adoption of advanced technology, better logistics, and more widespread use of cleaner fuels. The central region has improved steadily but still relies heavily on conventional fossil fuels. The western region, with its long distances, heavier freight dependence, and less developed infrastructure, starts from higher intensity levels and remains the most carbon‑intensive overall. Map‑based analysis reveals clear spatial gradients: clusters of low‑intensity provinces, mostly in the east, and pockets of persistently high intensity, often in the west.
Measuring gaps and how they are changing
To understand how unequal these intensities are, the study uses an inequality measure that can separate differences within regions from differences between them. The results show that overall inequality in transport carbon intensity has slowly increased over the study period. While some provinces within each region are converging—especially in the central region—gaps between regions are widening, particularly between the high‑performing east and the lagging west. On average, almost half of the total disparity comes from differences between regions, not just from variation among neighboring provinces. At the same time, the distribution of intensities is shifting leftward (toward lower values) nationwide, but with a noticeable tail of provinces that remain much more carbon‑intensive than the rest, creating a clear “high‑to‑low” gradient across the map.
Locked‑in patterns and neighbor effects
Looking only at snapshots in time can miss important dynamics, so the authors borrow tools from probability theory to see how provinces move between low, medium, and high intensity categories. They find strong “stickiness”: once a province falls into a low‑ or high‑intensity group, it tends to stay there. Moves usually occur only to adjacent levels—medium‑high to medium‑low, for example—rather than dramatic jumps. The study then adds geography explicitly, asking how a province’s neighbors affect its chances of moving up or down. When nearby provinces are high emitters, a province is more likely to remain or become high‑intensity; when neighbors are low emitters, the opposite holds. Statistical tests confirm that this spatial dependence is not a fluke. In effect, provinces form “clubs” of low‑ or high‑intensity transport systems that reinforce each other over time.
What this means for future transport policy
To a lay reader, the key message is that China’s transport sector is getting cleaner per unit of economic activity, but the benefits are unevenly shared. Some regions have raced ahead in adopting efficient, low‑carbon transport, while others are stuck with older, more polluting systems—and these patterns are reinforced by regional clusters and spillover effects. The study suggests that policies should do more than set national averages. They should target high‑intensity provinces and regions with tailored measures: investing in modern infrastructure in the west, spreading successful clean‑transport models from leading eastern provinces, and designing incentives that recognize the way neighboring regions shape each other’s progress. By accounting for both time trends and spatial linkages, China can boost the overall efficiency of its carbon cuts in transport and move more coherently toward its long‑term climate goals.
Citation: Tang, Y., Jiang, H. Spatiotemporal evolution and spatial differentiation of carbon emission intensity in the Chinese transport sector. Sci Rep 16, 13547 (2026). https://doi.org/10.1038/s41598-026-44230-z
Keywords: transport carbon intensity, China regional emissions, low‑carbon transport, spatial spillover, climate policy