Clear Sky Science · en
High-frequency turbidity by sensors as a proxy for total phosphorus: implications of sampling strategies on the water framework directive classification
Why cloudy water matters
Rivers and streams may look clear or cloudy, but that cloudiness can quietly decide whether governments must spend millions to clean them up. Across Europe, strict rules aim to keep rivers healthy by limiting nutrients like phosphorus, which can trigger algal blooms and choking weeds. Yet measuring phosphorus in the lab is costly and usually done only a few times a month. This study asks a deceptively simple question: can cheap, continuous sensors that measure water cloudiness stand in for phosphorus tests, and how often do we really need to sample to avoid misjudging the true health of a river? 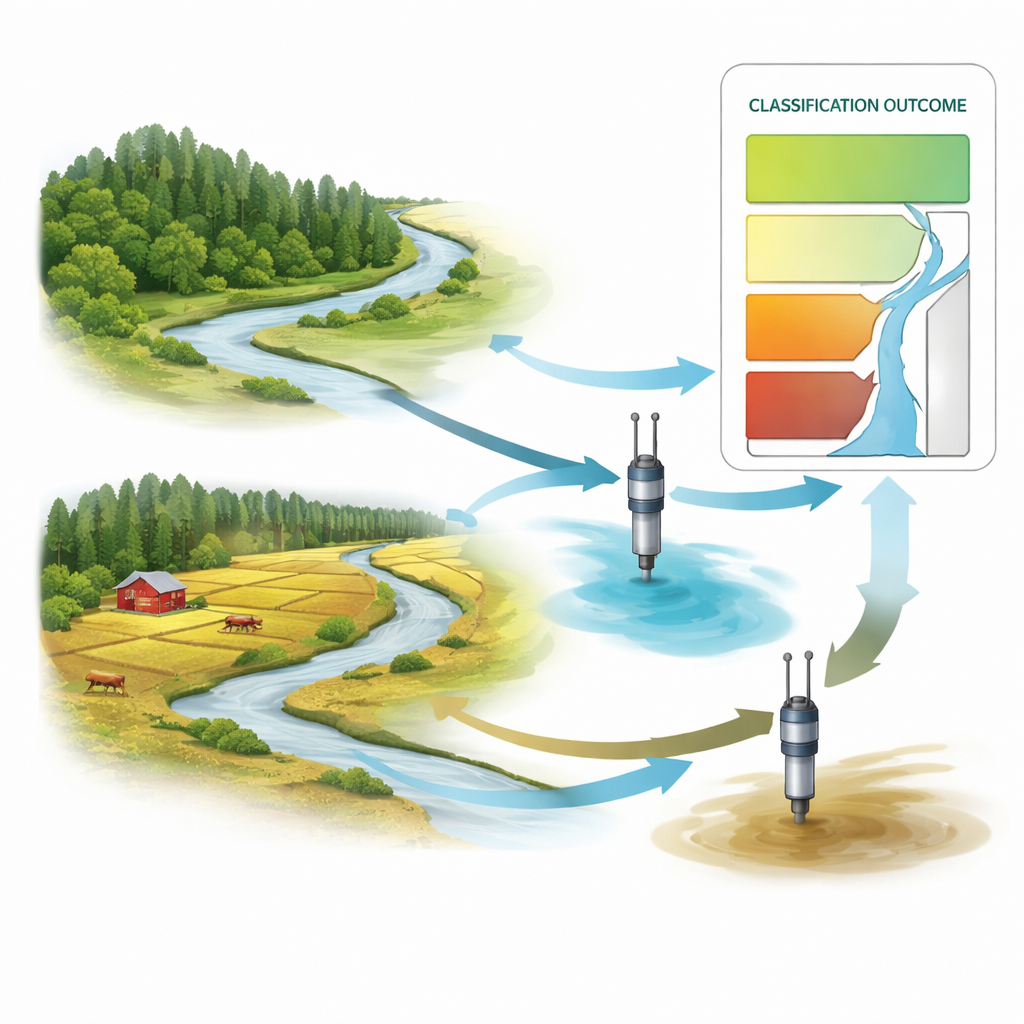
Watching rivers every hour
The researchers analysed three years of high‑frequency turbidity data from sensors in ten Nordic streams in Denmark, Finland, Norway, and Sweden. Turbidity is a measure of how cloudy the water is, reflecting the amount of fine particles such as soil and organic matter. Because phosphorus often clings to these particles, turbidity can act as a stand‑in for total phosphorus in many rivers. The team treated the hourly sensor readings as the closest thing to the river’s “true” average turbidity each year. They then mimicked common monitoring programmes by pretending they had only taken weekly, fortnightly, or monthly samples and compared the resulting averages with the hourly truth.
How often is often enough?
The virtual experiments showed that sampling less frequently quickly increases the risk of getting the yearly average wrong. On average across all ten streams, weekly sampling missed the true annual turbidity by about 17 percent, while monthly sampling pushed that uncertainty up to roughly 40 percent. The error did not just grow; it was also skewed. In most of the simulated sampling runs, the estimated average turbidity was lower than the true value, meaning that rivers tended to look cleaner on paper than they really were. 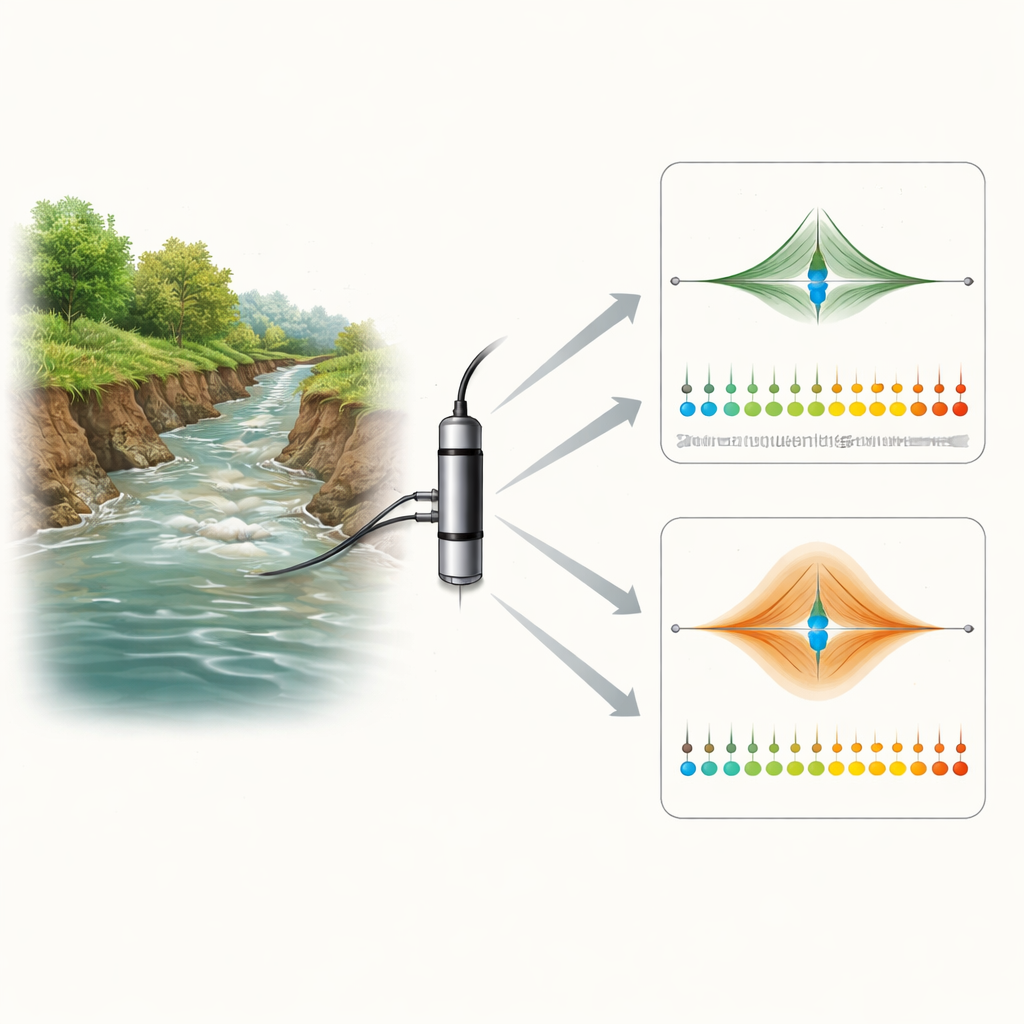
Small, farmed catchments are hardest to judge
The study went further by asking why some rivers were more uncertain than others. Using a statistical model, the authors found that three simple features explained most of the differences: how often samples were taken, how large the catchment was, and how much of that catchment was farmland. Smaller streams and those draining intensively farmed land had the greatest swings in turbidity and therefore needed many more samples to capture a reliable annual average. For example, a large river draining 800 square kilometres with only 20 percent agriculture would need about 29 samples a year to keep the uncertainty in turbidity near 10 percent. A tiny stream draining just 10 square kilometres but with 80 percent agriculture would need about 95 samples to reach the same level of confidence.
From cloudy water to phosphorus rules
For seven of the ten streams, turbidity and total phosphorus were strongly linked, allowing the team to convert turbidity records into estimated phosphorus concentrations. They then tested how the different sampling schedules would affect comparisons with legal target values that separate “good” from “moderate” water quality under the European Water Framework Directive. The ranges of possible yearly phosphorus averages were often wider than the legal threshold itself, especially with monthly sampling and in agricultural streams. That means that the same river, with the same true condition, could be classified into different status groups depending solely on how often it was sampled. The bias toward underestimating turbidity and phosphorus adds a further risk that degraded rivers could be misclassified as cleaner than they are, delaying action.
What this means for river protection
In plain terms, the study shows that “cheap” monitoring can become very expensive if it leads to wrong decisions. When phosphorus levels lie close to the boundary between acceptable and unacceptable water quality, infrequent sampling can mislead managers into either spending money on unnecessary measures or, more worryingly, postponing needed clean‑up efforts. The authors provide a practical equation that links river size, land use, and desired accuracy to the number of samples required each year. Combined with the growing use of turbidity sensors, this offers water managers a way to design smarter monitoring programmes that balance costs against the risk of misjudging the true health of our rivers.
Citation: Skarbøvik, E., Isidorova, A., Kämäri, M. et al. High-frequency turbidity by sensors as a proxy for total phosphorus: implications of sampling strategies on the water framework directive classification. Sci Rep 16, 13317 (2026). https://doi.org/10.1038/s41598-026-44177-1
Keywords: turbidity sensors, river monitoring, phosphorus pollution, sampling frequency, water quality standards