Clear Sky Science · en
Deterministic statistical patterns preceding ice shocks revealed by ice deformation measurements
Cracking Sounds from Spring Ice
On cold lakes, loud booms and cracks can echo across the ice as winter loosens its grip. These "ice shocks" are not just a curiosity for skaters and anglers—they are small-scale cousins of earthquakes, created when warming ice suddenly breaks. This study looks beneath the noise, asking whether subtle patterns in how the ice slowly deforms can reveal when one of these shocks is about to happen, minutes to an hour in advance.
A Natural Laboratory on a Frozen Lake
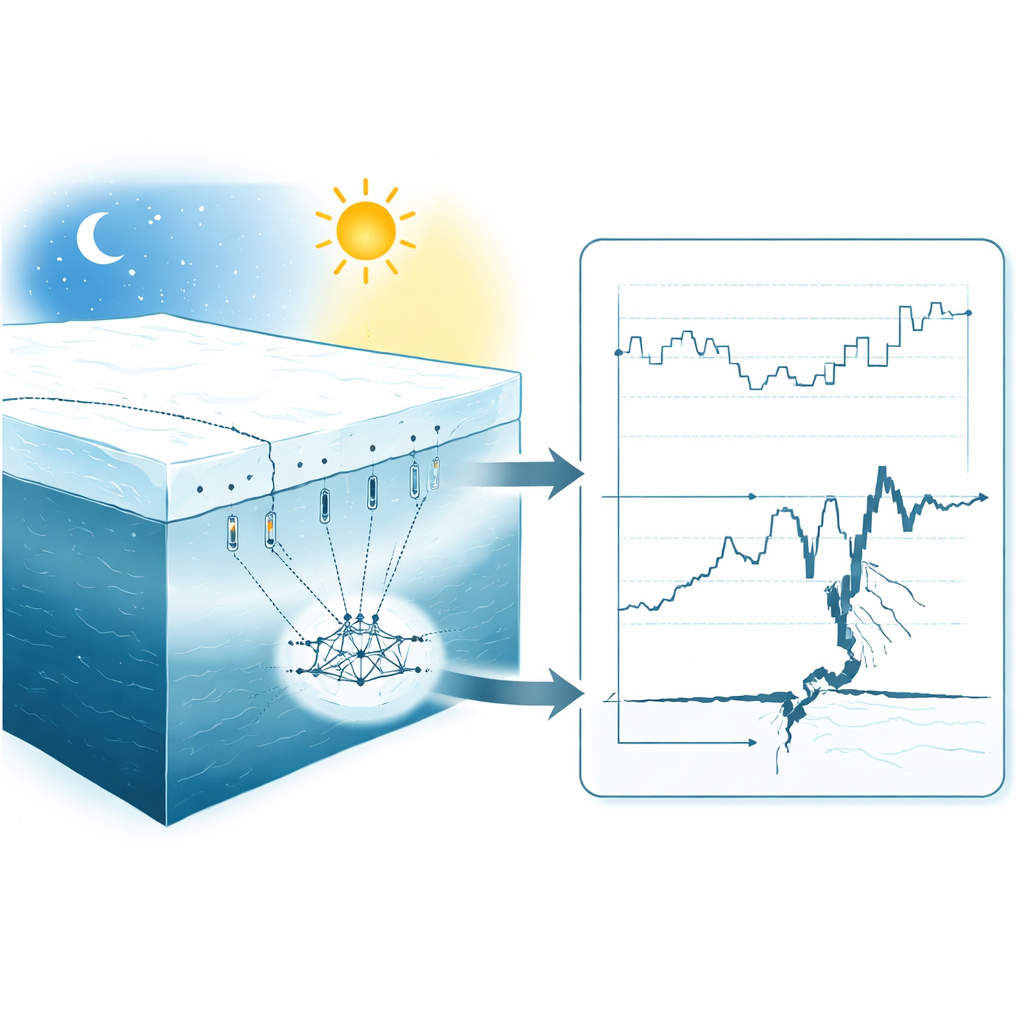
Lake Baikal in Siberia offers a unique place to study these events. Each spring, sharp day–night temperature swings make the lake’s thick ice expand and contract. Near the surface the ice behaves like a brittle solid, while deeper layers flow more slowly, much like rock in Earth’s crust. Because the ice sheet is accessible and the environment is relatively controlled, it can act as a model for understanding how stress builds and releases in the planet’s outer shell. The researchers set up a temporary test site on the lake, spanning a long crack in the ice. They installed nine highly sensitive sensors that continuously measured tiny stretches and squeezes of the ice during several weeks in late winter, focusing on days when sudden ice shocks occurred.
Turning Noisy Motion into Hidden Signals
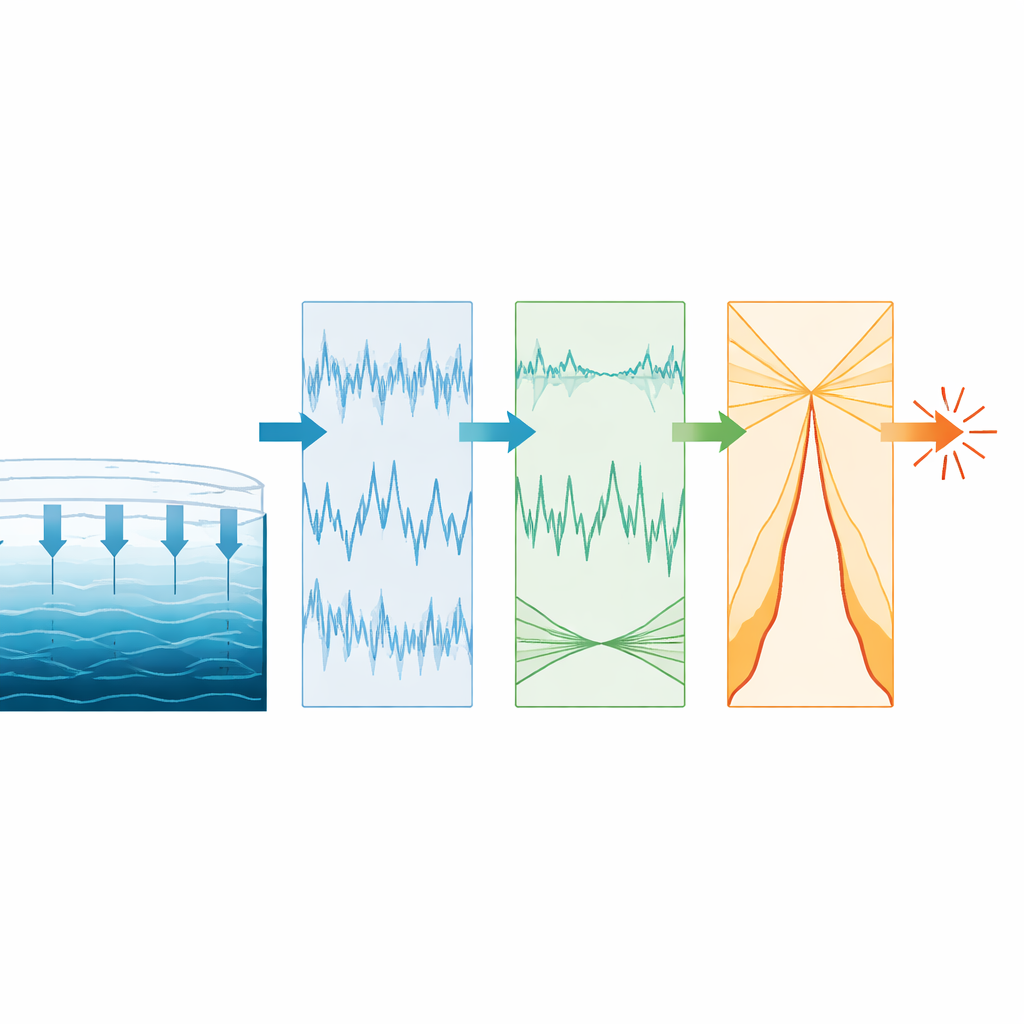
The raw measurements from the sensors look messy—jagged curves of continuous motion mixed with the rare sharp jumps when the ice actually breaks. Instead of chasing those obvious jumps, the team focused on how the background motion changes as a shock approaches. They treated each stretch of data as a mixture of ordinary random fluctuations plus an additional, more organized component that reflects the final stages of crack formation. To tease these apart, they applied a mathematical trick: transforming the deformation data using a sine function and then studying how often different values appear in each short time window. From these probabilities, they built a single number—called a statistical functional—for every window. This number captures how ordered or disordered the deformation pattern is without relying on any specific physical model of the ice.
Lines that Point Toward Impending Failure
When the researchers plotted this statistical functional over time, something striking emerged before each ice shock. Instead of wandering aimlessly like a typical noisy signal, the curve began to trace out straight, orderly segments. The team defined several types of simple geometric features in these plots: local trends that look like straight lines, pairs of nearly parallel lines forming narrow channels, and moving boundaries that the curve repeatedly approaches. Using strict rules to avoid chance alignments, they marked the last moment when each of these linear features was "tested" by the evolving curve and treated those times as precursors of the upcoming ice shock.
Countdown Minutes Before the Crack
Across several days and two sensor stations, the researchers identified twenty‑five such precursors linked to three ice shocks. These signals did not appear at random times. A few showed up as early as 40 to 130 minutes before a shock, more appeared 20 to 30 minutes ahead, and the majority clustered within the final 20 minutes before the ice failed. In some cases, extending a channel boundary or moving line past its last test point hit the exact time of the later shock, suggesting a tight connection between the growing order in the statistics and the approaching break. During a quiet day with no ice shocks, the same analysis produced only a couple of weak precursors, underscoring that the rich pattern of linear structures is strongly tied to real fracture events rather than background noise.
From Frozen Lakes to Sudden Natural Hazards
For non-specialists, the key takeaway is that the ice does not fail without warning at the microscopic level. Well before a dramatic crack rings out, the seemingly random jostling within the ice becomes subtly more organized, and this growing order can be detected by looking at statistics rather than at individual spikes in activity. The authors show that these deterministic patterns provide short-term warning—typically on the order of an hour, with a flurry of signals in the last minutes—more reliably and with fewer false alarms than several existing methods. Because the ice of Lake Baikal mimics how Earth’s crust behaves under stress, similar statistical tools could eventually help scientists recognize the final approach to other abrupt events, from earthquakes to sudden slips in fault zones, offering a new window into how complex natural systems prepare to fail.
Citation: Volvach, A.E., Bornyakov, S.A., Kogan, L.P. et al. Deterministic statistical patterns preceding ice shocks revealed by ice deformation measurements. Sci Rep 16, 13931 (2026). https://doi.org/10.1038/s41598-026-44091-6
Keywords: ice fracture, earthquake precursors, Lake Baikal, statistical patterns, cryoseismology