Clear Sky Science · en
Rapid response and impact assessment of water quality incidents in urban water distribution systems using forensic techniques
Why clean tap water can change without warning
Most city residents take clear, safe tap water for granted, yet many have experienced brown or cloudy water after nearby construction or a sudden main break. This study looks at what happens inside buried water pipes when water quality suddenly worsens, and how utility crews can act quickly to stop dirty water from spreading to thousands of homes. The researchers propose a new way for water utilities to decide, in real time, which valves to close, which areas to isolate, and how fast they must move to keep people safe and maintain trust in the tap.
When city pipes turn water cloudy
Urban water systems are complex webs of pipes, tanks, pumps, and valves that must deliver safe water around the clock. Even with modern treatment plants, problems still occur inside the distribution pipes themselves. Rust and mineral deposits can break loose and cause red or black water. Sediments can be stirred up by sudden changes in flow when valves are opened or closed, when pipes break, or when construction crews tie in new lines. In some cases, small animals or foreign materials can enter through poorly managed side systems. These events do not just look unappealing; they can carry microorganisms and metals, disrupt service, and erode public confidence in tap water.
Why speed and location matter so much
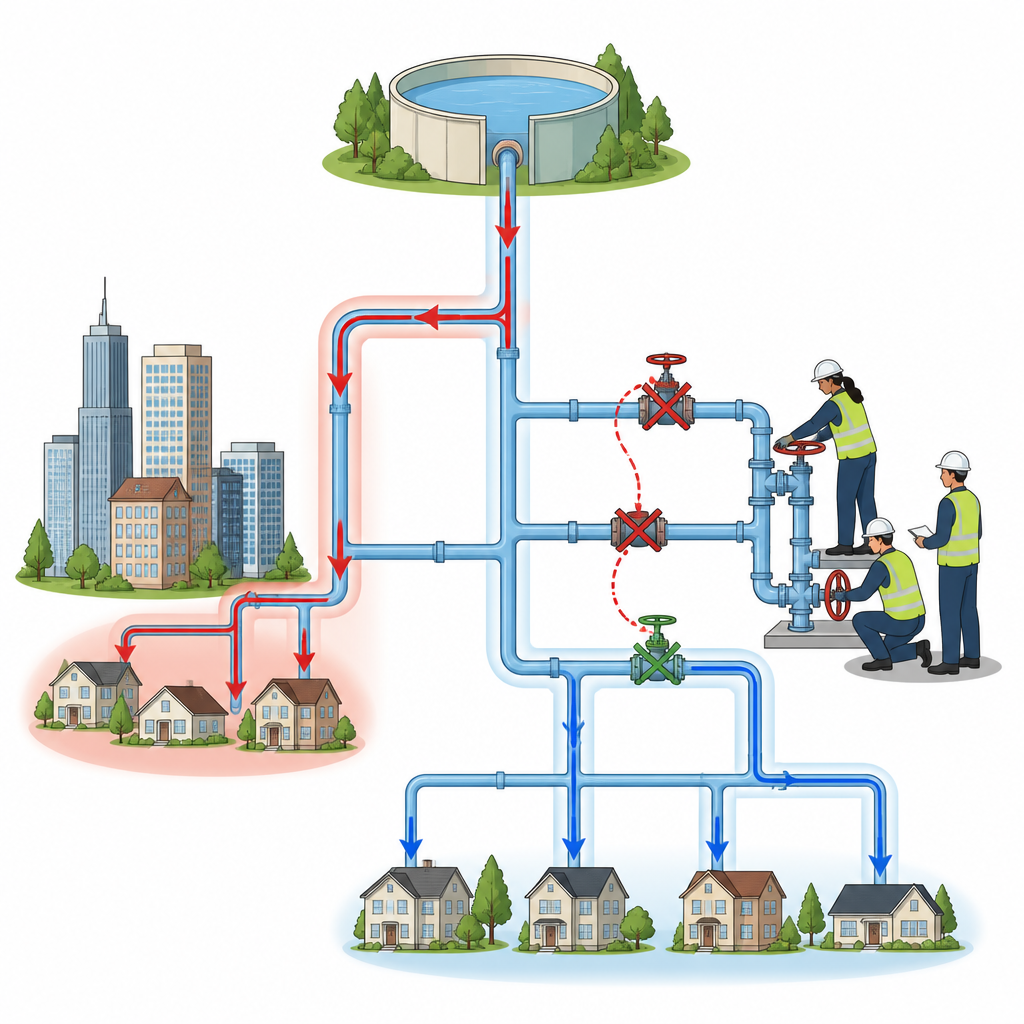
Once a water quality incident starts, the key questions for a utility are: how far will the problem travel, how many customers will it reach, and how quickly can crews stop it. The answer depends on the layout of the network, how fast and in which direction water is moving, and how long it takes to notice the problem and get people to the site. Traditionally, many studies have focused on placing sensors and detecting incidents, but much less on the difficult minutes and hours afterward, when staff must locate valves in the field, decide which ones to operate, and accept that there is not enough time to shut everything down. The authors argue that real-world constraints such as travel time, valve size, and the effort needed to operate each valve must be built into any useful response plan.
Using forensic tools to trace dirty water
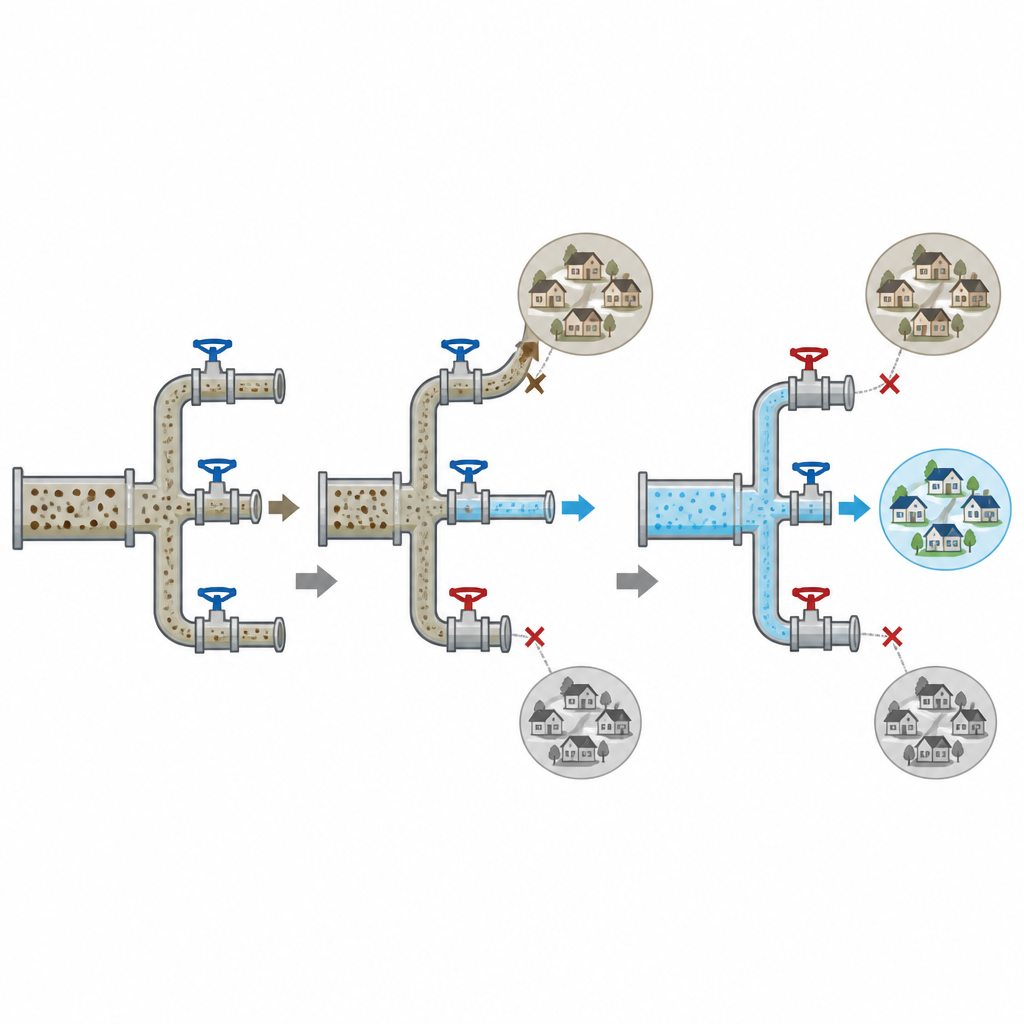
The researchers adapt forensic ideas, normally used to retrace events after an accident, and apply them in a forward-looking way. Using a hydraulic model of the pipe system, they run many simulations with varying water demands to see how cloudy water would move from different starting points. From these results they estimate how long it takes for a disturbance to travel between key points in the network, assuming that the cloudy water moves with the bulk flow. Instead of trying to predict every detail of water chemistry, they focus on how long it takes for affected water to reach different neighborhoods. This offers a fast, practical picture of where the incident is likely to spread and how much time is available before new areas are hit.
Breaking the network into workable pieces
A central idea in the study is the Possible Operated Segment, or POS. In theory, engineers can draw perfect isolation zones on a map by closing certain valves, but in an emergency, crews may not be able to find or operate all of them in time. The POS concept keeps only those pipe sections that can realistically be isolated: valves must be correctly mapped, large enough to be useful, reachable within about an hour, and placed at important branch points. Each POS becomes the smallest unit that can be shut off in practice. By combining this practical segmentation with travel time estimates, the team can identify which segments can be cut off before contaminated water arrives and which are too slow to save in a fast-moving event.
Seeing risk grow over time
To make these ideas easy for operators to use, the study refines a visual tool called the Cause–Impact–Duration, or CID, plot. On these plots, time runs along one axis, while the number of affected customers grows as the incident spreads. Different shades show how severe the impact becomes if action is delayed. For four common types of cloudy water events, the authors show how fast harm grows in two real service areas: one with a tree-like network, where water largely moves in one direction, and another with a more looped layout. In the tree-like system, dirty water moves quickly and the window to act is short, while the looped system slows spread and offers more time but requires more valve operations. Repeated use of these plots can also reveal chronic weak spots that might justify adding remote-controlled valves or replacing old mains.
What this means for city water users
In everyday terms, the study offers a roadmap for water utilities to move from “we see a problem” to “here is exactly where and when to close valves” in a structured way. By blending simple travel time modeling, realistic assumptions about crew performance, and clear visual tools, the framework helps utilities limit how many people receive cloudy or unsafe water and how many must temporarily lose service. While the method still needs further testing with live incidents and more detailed pressure effects, it points toward smarter, faster responses and long-term upgrades that make urban water systems more resilient under growing stress.
Citation: Oh, Y., Park, H., Kim, T. et al. Rapid response and impact assessment of water quality incidents in urban water distribution systems using forensic techniques. Sci Rep 16, 15839 (2026). https://doi.org/10.1038/s41598-026-44014-5
Keywords: urban water quality, water distribution systems, emergency response, valve operations, turbidity incidents