Clear Sky Science · en
A do-it-yourself water quality sensor network to elucidate contaminant signatures and improve land management advice
Why Watching Our Rivers Closely Matters
Across the world, rivers and estuaries are struggling under the weight of pollution from farms and towns. Yet most monitoring programmes still take only occasional samples—more like checking a patient’s pulse once a month than using a heart monitor. This study shows how a do-it-yourself network of smart, low-cost sensors, paired with modern computer modelling, can track pollution in near real time. The work, carried out in a farming catchment that drains to New Zealand’s Waihi Estuary, reveals how much contamination traditional methods miss and how a denser, cheaper sensor network can guide smarter, more targeted land management.
Building a Homegrown River Watch
The researchers began with a standard regional council monitoring programme: professionals visiting 10 river sites once a month to collect bottles of water for laboratory analysis of nitrogen, phosphorus, and sediment. To fill in the big gaps between visits, they installed at each site a compact, low-cost station built around an open-source "Mayfly" data logger. Each station carried two research-grade sensors: one measuring water level, temperature, and conductivity, and another measuring cloudiness (turbidity), all powered by a small solar panel and battery. Every 15 minutes, these stations recorded the river’s condition, creating a continuous picture of how streams responded to weather, farming, and seasons.
Turning Sensor Readings into Pollution Estimates
On their own, the sensors do not measure actual pollutant amounts; instead they track easy-to-measure signals that change when contaminants move. To bridge this gap, the team collected extra water samples during 21 storm events using automatic samplers placed beside the sensors. These laboratory results, paired with the simultaneous sensor data, were used to train artificial neural networks—computer models inspired by the way brains recognise patterns. For each of the 10 sites and for each contaminant (total nitrogen, total phosphorus, and suspended sediment), a separate model learned how to translate the sensor readings and flow estimates into pollutant concentrations every 15 minutes, complete with uncertainty bands indicating how confident the model was in each estimate.
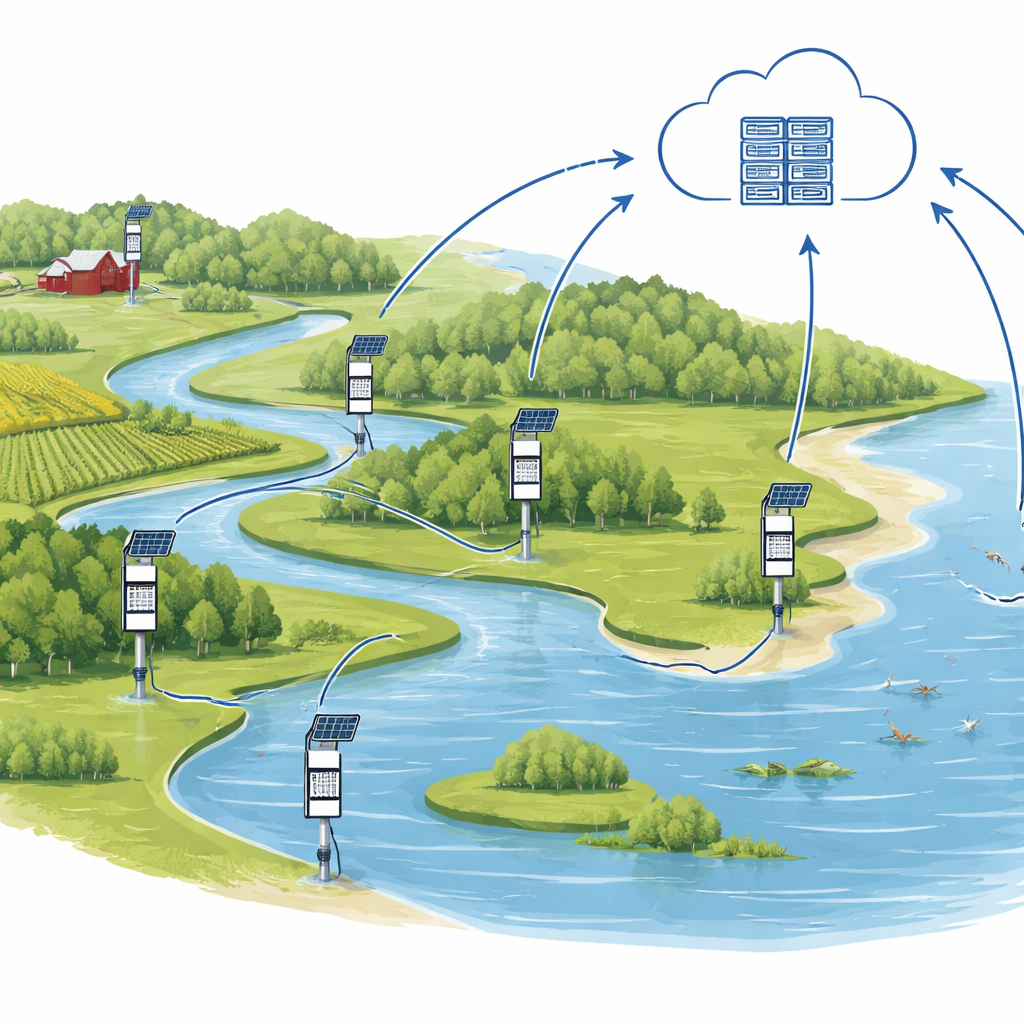
What the High-Speed View Revealed
With continuous records in hand, the researchers could follow when and where pollutants surged. They found that loads of nitrogen, phosphorus, and sediment delivered to the estuary were often much higher than suggested by monthly sampling alone—by 6% for nitrogen, 32% for phosphorus, and a striking 85% for sediment at key downstream sites. Short-lived storms, which traditional programmes often miss, turned out to be crucial: just a handful of days could account for a large share of annual export, particularly for phosphorus and sediment. The team also saw that sub-catchments behaved very differently. Some, like parts of the Pongakawa River, released nitrogen steadily through groundwater-dominated baseflow, while others, such as the Pokopoko streams, stored up phosphorus and sediment in the landscape and then flushed them out in sudden pulses during heavy rain.
From River Signals to On-the-Ground Action
These distinct "signatures" of when and how contaminants moved have direct consequences for land managers. Rather than spreading effort thinly across an entire region, the results point to a small number of sub-catchments that contribute most of the pollution load to Waihi Estuary. In areas where nitrogen trickles in mainly through groundwater, the most effective responses involve reducing how much nitrate builds up in soils—by adjusting fertiliser timing and rates, modifying stocking densities, and favouring practices that slow water movement through the soil. In places where phosphorus and sediment arrive in big storm-driven bursts, the study highlights the value of measures that intercept and slow runoff: constructed wetlands, retention bunds, riparian buffers, and stabilisation of eroding gullies and channels. By matching the remedy to the dominant pathway, investments can deliver bigger improvements for the same cost.
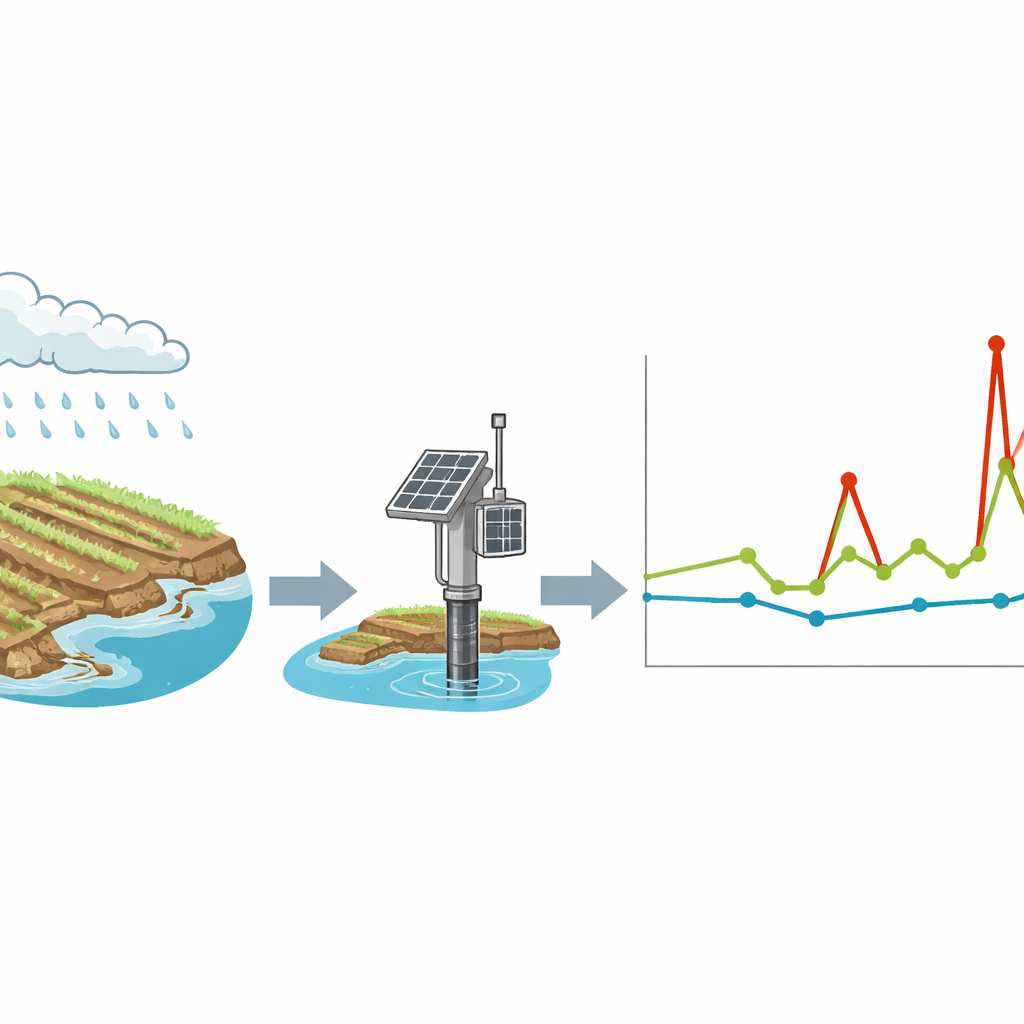
A New Toolkit for Cleaner Estuaries
For non-specialists, the central message is that how often and where we measure rivers fundamentally changes what we think is happening. This DIY sensor network, combined with smart modelling, showed that traditional monthly sampling can significantly understate the true burden of nutrients and sediment reaching a sensitive estuary. Yet it also demonstrated that affordable, open-source tools can capture the fast, uneven bursts of contamination that matter most for ecosystems and communities. By revealing which places and moments drive the greatest damage, this approach offers a practical, scalable way for councils, farmers, and local groups to design targeted, catchment-specific actions that stand a much better chance of restoring downstream waters.
Citation: Dare, J.E., Özkundakci, D. & McDowell, R.W. A do-it-yourself water quality sensor network to elucidate contaminant signatures and improve land management advice. Sci Rep 16, 11646 (2026). https://doi.org/10.1038/s41598-026-43915-9
Keywords: water quality monitoring, DIY environmental sensors, agricultural pollution, nutrient and sediment loads, estuary management