Clear Sky Science · en
Precise peak width estimation for solving key challenges in biosignal and spectral analysis
Why the shape of a signal matters
From heartbeats captured by a smartwatch to the tiny peaks in a material’s spectrum, much of modern science depends on reading wavy lines. A key detail in those lines is how wide each "bump" or peak is: this width can reveal whether the heart is healthy or a surface is chemically pure. Yet in real life, signals are noisy, peaks overlap, and measurements come from many channels at once. This article introduces a new mathematical way to measure peak width that stays reliable under these messy, real-world conditions, with special focus on heart recordings and X-ray spectroscopy of materials.
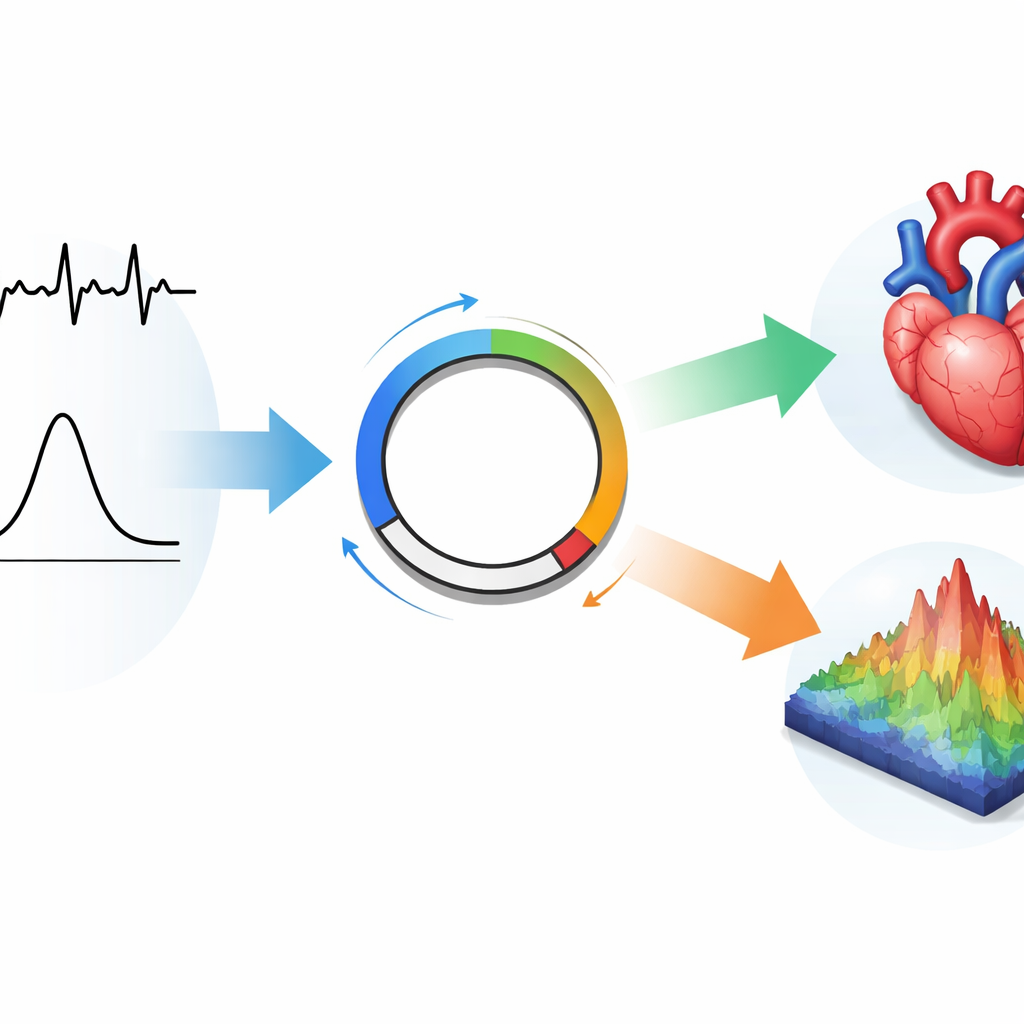
Measuring bumps in noisy waves
Scientists often summarize a peak by its Full Width at Half Maximum (FWHM) – the distance between the two points where the peak falls to half its maximum height. That sounds simple, but real signals are rarely neat. Peaks can lean to one side, share space with neighbors, ride on drifting baselines, or be buried in noise. In heart recordings (electrocardiograms, or ECGs), doctors care about how long key segments such as QRS and QT last, because these durations help flag dangerous rhythm problems. In X-ray Photoelectron Spectroscopy (XPS), the width of spectral peaks reveals how atoms are bonded and how pure or mixed a material is. Existing methods for estimating width often fail when peaks overlap, when the signal is asymmetric, or when multiple recording channels each give a slightly different picture.
A circular view of waves
The authors build on a framework called the Frequency Modulated Möbius (FMM) model, which represents oscillatory signals using a small set of parameters linked to a circular phase. Instead of viewing a peak only as a bump on a straight line, the peak is tied to a journey around a circle, where specific angles and a width parameter control its shape. Within this framework, the team derives a new, exact expression for FWHM (called FWHMF) and introduces a related measure, wave duration (WDF), that captures most of the meaningful peak area without stretching across the entire cycle. Because these measures depend directly on the model’s shape parameters rather than on where a noisy baseline lies, they remain stable even when the signal is distorted or asymmetric. The same circular idea naturally extends to overlapping peaks and to multi-channel recordings: the different channels are treated as views of a single underlying circular wave, yielding one consistent width for all of them.
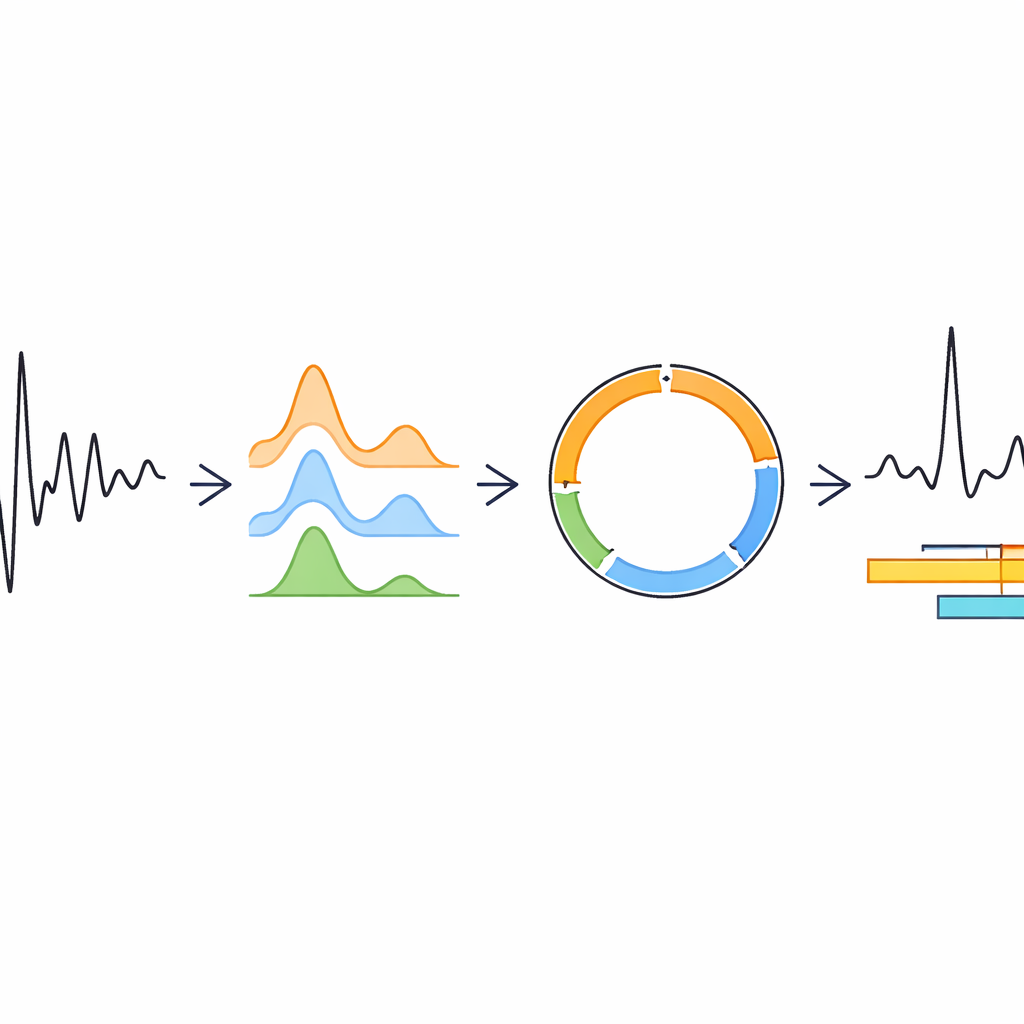
Sharper timing in heart signals
To test the method on heart data, the authors applied it to ECG recordings with various channel setups, from full 12-lead hospital systems down to just two leads, as in many wearable devices. Using previously developed FMM-based models of the heartbeat, they located the main Q, R, S, and T waves and then used the new width measures to define QRS and QT segment lengths. These estimates were compared with expert annotations from a gold-standard database and with results from a widely used commercial algorithm. Across thousands of beats and different lead configurations, the FMM approach stayed within accepted tolerance limits and classified abnormal QRS and QT durations with low error rates. Importantly, it remained robust when signals were noisy, when wave shapes were unusual, or when only a few leads were available—conditions under which many existing methods degrade.
Cleaner peaks in material spectra
The researchers also examined how well their approach measures peak widths in XPS spectra, a core tool for probing the chemistry of surfaces. Using simulated spectra with varying degrees of asymmetry and noise, they compared FMM-based peak width estimates with those from common peak shapes such as Gaussian, Lorentzian, and Voigt-like models, as well as simple empirical measurements taken directly from data. In simple, textbook-like peaks, traditional models performed competitively. But for sharper, asymmetric, or more complex patterns—especially when noise was present—the FMM method often achieved the best combination of accurate fit and reliable FWHM estimates. When applied to real spectra from an online XPS database, the FMM model matched the overall peak shapes extremely well and produced width values that closely tracked high-quality empirical references, despite using fewer parameters than some competing models.
What this means for everyday science tools
In practical terms, this new framework offers scientists and clinicians a unified way to measure how wide peaks and waves are, even when signals come from many channels, are noisy, or have awkward shapes. For ECGs, it promises more consistent estimates of clinically vital intervals like QRS and QT, potentially improving diagnoses from hospital monitors and consumer wearables alike. For XPS, it delivers a robust way to characterize peak widths that underlie judgments about material composition and quality. Because the method is mathematically grounded, computationally efficient, and adaptable across fields, it could become a building block for future automated tools that interpret signals in medicine, materials science, and beyond.
Citation: Rueda, C., Fernández, I., Canedo, C. et al. Precise peak width estimation for solving key challenges in biosignal and spectral analysis. Sci Rep 16, 13495 (2026). https://doi.org/10.1038/s41598-026-43712-4
Keywords: signal analysis, electrocardiogram, spectroscopy, peak width, mathematical modeling