Clear Sky Science · en
A five-dimensional geometric uniformity framework for spherical diamond grids
Why mapping the whole world is harder than it looks
Behind every global weather map, climate model, or satellite image lies a simple question: how do we divide the curved Earth into little pieces a computer can handle? It turns out there is no perfect way to tile a sphere, and the small imperfections in these digital grids can quietly distort data and weaken the performance of modern AI models. This paper tackles that hidden problem for a popular family of "diamond" grids wrapped around the globe, and shows which designs give the fairest and most reliable view of our planet.
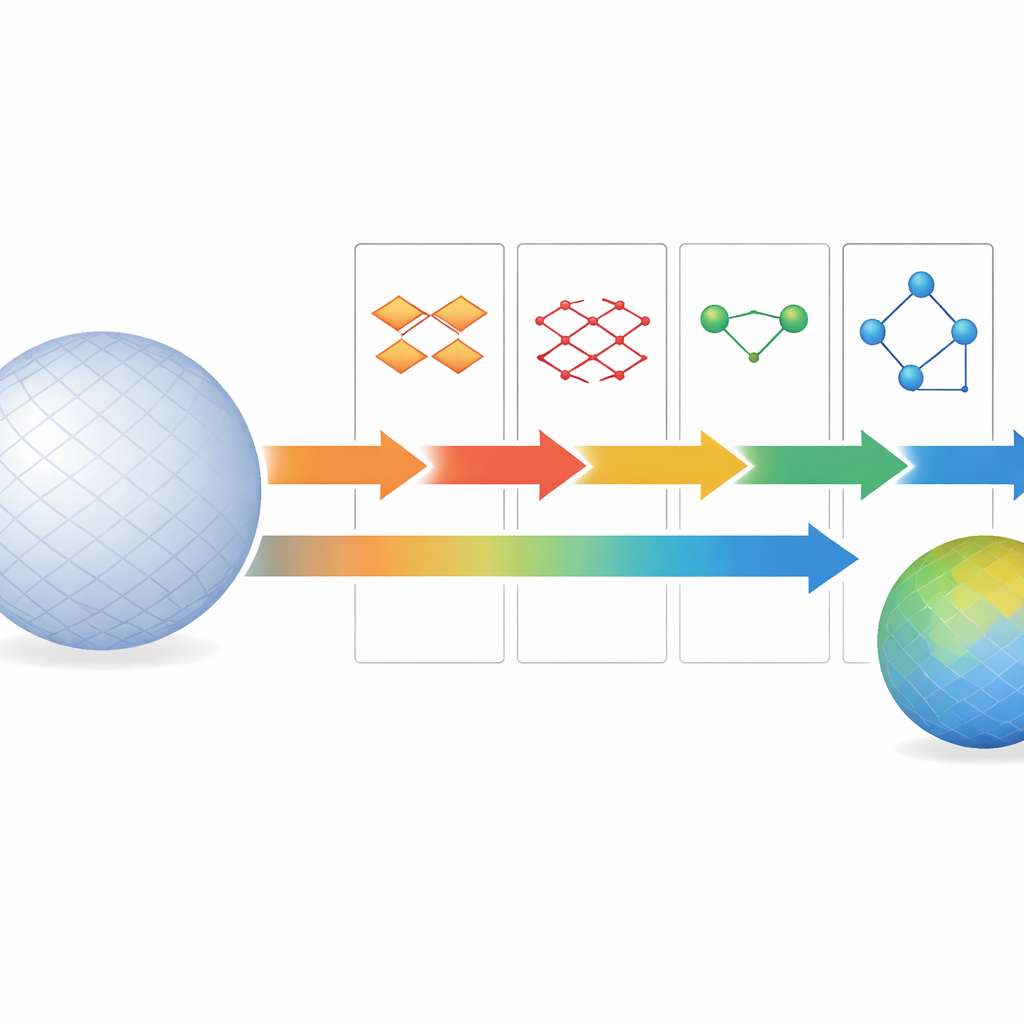
Cutting Earth into digital diamonds
Many global systems now use Discrete Global Grid Systems, or DGGS, which cover the Earth with a regular quilt of cells instead of the usual latitude–longitude rectangles. Diamond grids are a special type, made by pairing triangles into rhombus-shaped tiles and refining them into finer and finer pieces. These grids are attractive because they can handle massive Earth data and feed it directly into AI, such as neural networks that run on the sphere. But there is a catch: the diamonds cannot all be identical, and some regions get subtly stretched, squashed, or misaligned. Earlier assessment rules, known as Goodchild’s criteria, mostly checked individual cell size and shape, and worked better for triangles and hexagons than for diamonds. They missed how neighboring cells could be unevenly spaced or oddly angled around each point.
A five-part scorecard for grid fairness
The authors propose a new, five-dimensional framework that looks not only at what each diamond cell looks like, but also at how it sits among its neighbors. They keep three classic aspects—shape, how cells connect, and area—and add two new ones that are crucial for diamonds: distance uniformity and angle uniformity. Distance uniformity asks whether the centers of neighboring cells are all roughly the same distance from a central cell. Angle uniformity checks whether those neighbors are spread evenly around it, instead of bunching up in one direction and leaving gaps elsewhere. Together, these five measures build a more complete picture of how fair and regular a grid really is, especially along the seams where faces of the underlying polyhedron meet.
Putting cube, octahedron, and icosahedron to the test
To see how common grid designs compare, the study examines three spherical diamond grids built from different building blocks: the cube (six faces), the octahedron (eight faces), and the icosahedron (twenty faces). All three are subdivided into finer diamonds on the sphere, and the five metrics are computed at multiple levels of detail. Using statistical tools that capture both typical behavior and extreme outliers, the authors show a clear pattern. The icosahedron-based grid is consistently the most uniform in shape, connectivity, cell area, neighbor distances, and neighbor angles. Surprisingly, the octahedron-based grid, despite starting with more faces than the cube, performs worse than the cube in several dimensions—especially in angular uniformity.
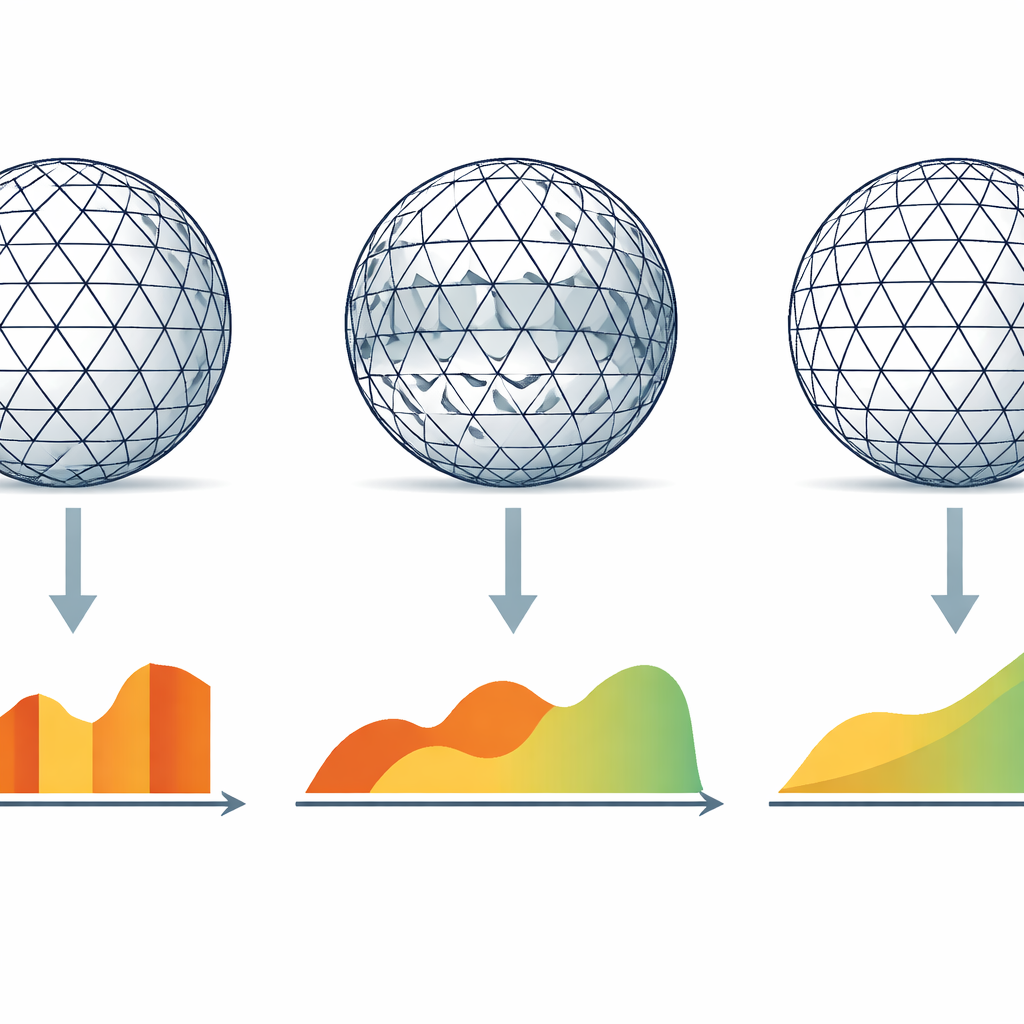
Hidden trouble spots and their real-world impact
The most dramatic flaw appears in the octahedral grid near the boundaries where its faces meet. There, the process of merging triangles into diamonds creates highly distorted cells whose corners nearly collapse onto each other. Neighbors become squeezed on one side and stretched on the other, leading to extremely tiny angles between some neighboring directions and very large angles between others. These harsh irregularities show up as huge spikes in the angle metric and would be easy to overlook if only area or shape were checked. To test whether such geometric quirks matter in practice, the authors train a spherical neural network to classify land-use types on each of the three grids. The results line up with the geometry: the most uniform icosahedral grid yields the highest accuracy and the most stable performance across categories, the cube-based grid is slightly worse, and the octahedral grid—plagued by angular distortion—performs the worst.
What this means for global data and AI
For readers, the takeaway is that not all world-gridding schemes are created equal, and more starting faces do not automatically mean better quality. The way we carve the planet into digital pieces can subtly shape the behavior of large-scale simulations and AI systems that depend on those pieces. By offering a five-part scorecard that catches both everyday variation and rare but severe distortions, this work gives scientists and engineers a clearer basis for choosing and improving global grids. In simple terms, smoother, more uniform diamond grids—especially those based on the icosahedron—provide a straighter playing field for planetary data and the AI tools built on top of it.
Citation: Duan, Y., Li, J., Shi, L. et al. A five-dimensional geometric uniformity framework for spherical diamond grids. Sci Rep 16, 13290 (2026). https://doi.org/10.1038/s41598-026-43130-6
Keywords: discrete global grid, spherical diamond grid, geospatial data, grid uniformity, spherical deep learning