Clear Sky Science · en
DengueGNN: Graph-based deep learning for modeling disease spread dynamics and prediction
Why tracking dengue outbreaks is getting smarter
Dengue fever, spread by mosquitoes, is surging worldwide as cities grow, people travel more, and climates shift. Health agencies need to know where cases will spike weeks in advance so they can spray mosquitoes, prepare hospitals, and warn communities. This paper introduces a new artificial intelligence framework that treats the world as a web of connected regions and learns how dengue moves through that web over time, aiming to give earlier and more reliable warnings of outbreaks.
Seeing places as a connected web
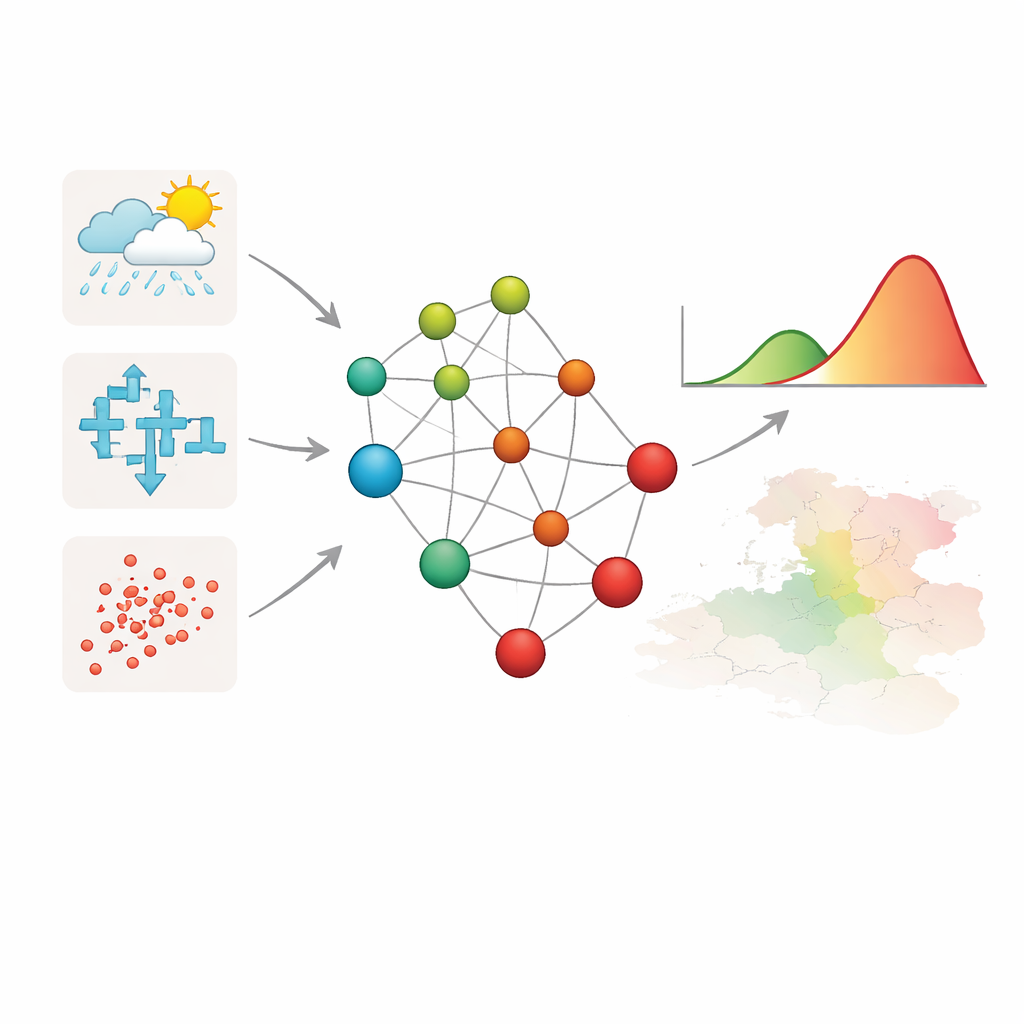
The researchers start by reimagining geography as a living network. Each region or district becomes a “node,” and links between nodes represent how easily dengue can travel, whether through neighboring borders or human movement such as commuting and travel. The model constantly updates this network using information about population, distance between places, and how people are likely to move, so that the connections can strengthen or weaken as conditions change. On top of this, each node carries local data such as recent dengue cases, temperature, rainfall, and population density, giving the model a rich picture of both where people live and how mosquitoes thrive.
Following disease patterns over time
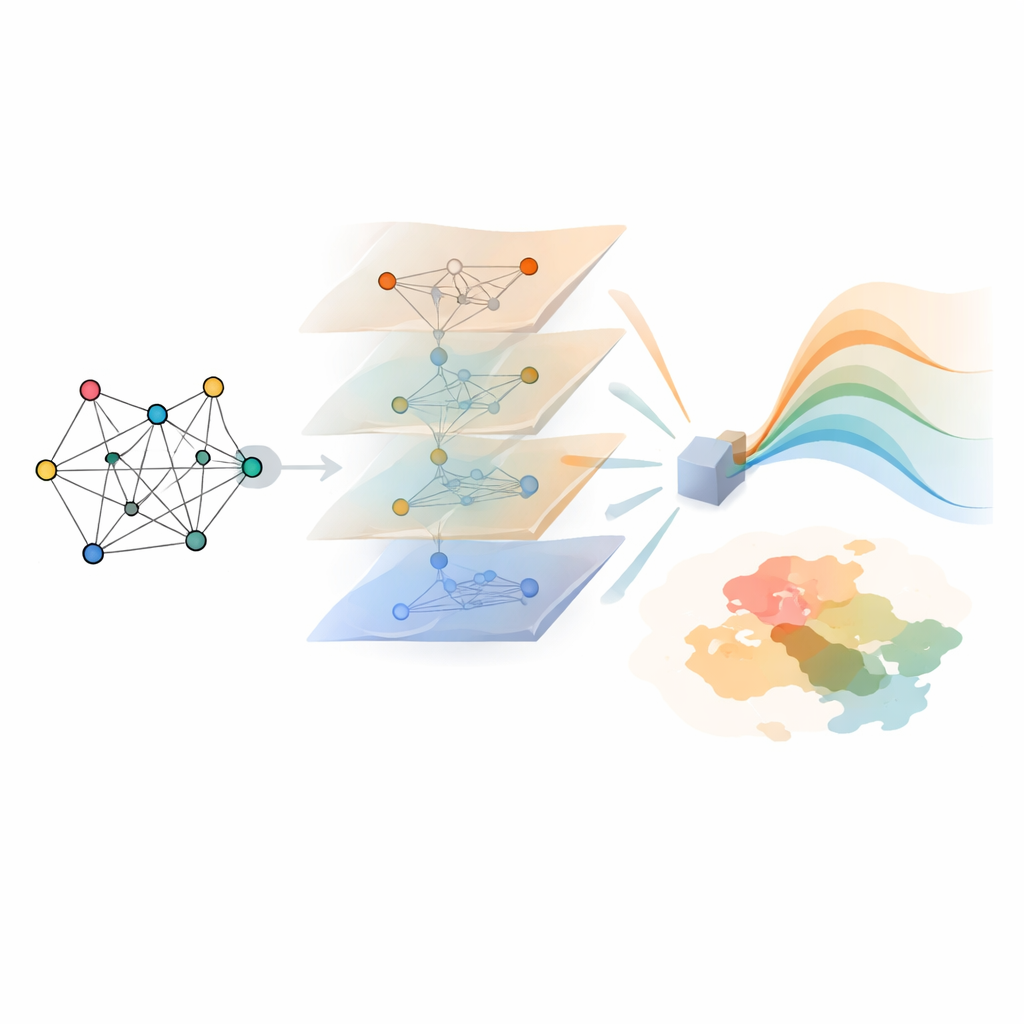
Predicting outbreaks is not only about where the disease can go, but also when. The framework uses a type of deep learning that is well suited to time series to follow how dengue cases rise and fall week by week in each region. An attention mechanism helps the system focus on the most important moments in the past, such as recent surges or seasonal peaks, instead of treating all weeks as equally informative. By combining the evolving network of regions with these time-aware patterns, the model can learn how waves of infection spread from one place to another and how climate and mobility shape this motion.
Blending weather, movement, and history
A key strength of the approach is how it fuses different kinds of information. For each region, the system merges its learned time pattern with environmental factors like temperature and rainfall and with indicators of human mobility. This blended representation is then used to predict how many dengue cases are likely to appear one, two, or four weeks into the future. The model also estimates its own uncertainty, producing not just a single number but a range of likely outcomes, which is crucial for cautious public health planning.
Testing against real-world data
To see how well this framework works, the authors turned to OpenDengue, a global database of weekly dengue cases spanning multiple countries and decades, alongside matching climate and mobility data. They compared their method with ten widely used forecasting approaches, ranging from classic statistical tools to modern deep learning models. Across both short-term (one-week) and medium-term (four-week) forecasts, their system consistently produced lower errors and better matched the geographic clustering of real outbreaks. It was particularly effective at tracking shifts between quiet periods, seasonal waves, and sudden extreme spikes, suggesting that the dynamic network and attention mechanisms help the model adapt when conditions change.
Making forecasts understandable and useful
Because public health decisions require trust, the authors added tools to explain the model’s behavior. One technique highlights which regions and connections in the network most strongly drive predictions, flagging likely hotspots and important travel routes. Another ranks input factors such as rainfall, temperature, and mobility by how much they influence forecasted cases. These explanations show that human movement, followed by climate conditions, are major drivers of predicted outbreaks. The team also ran controlled tests by selectively removing parts of the model: turning the dynamic network into a fixed one, dropping attention, or ignoring mobility all made forecasts noticeably worse, confirming that each ingredient adds value.
What this means for everyday health protection
For non-specialists, the takeaway is that this framework offers a smarter, more transparent way to anticipate dengue surges at a regional level. By treating cities and districts as an interconnected web and learning how weather, movement, and past cases interact, the system can provide multi-week outlooks that are both accurate and interpretable. Health agencies could use these forecasts to target mosquito control, staff hospitals, and warn communities before outbreaks escalate, potentially reducing illness and saving resources. Future work may fold in even more local details, such as mosquito abundance and social conditions, and further streamline the approach for real-time use, but this study shows that graph-based deep learning can meaningfully improve how we see and respond to dengue spread.
Citation: GulMohamed, R.B., Hetany, W., Almaimani, H.A. et al. DengueGNN: Graph-based deep learning for modeling disease spread dynamics and prediction. Sci Rep 16, 10584 (2026). https://doi.org/10.1038/s41598-026-43073-y
Keywords: dengue forecasting, disease spread modeling, graph neural networks, human mobility, climate and health