Clear Sky Science · en
Geospatial analysis of surface water and groundwater quality using GIS in Ishaka subcounty, Bushenyi District, Uganda
Why the Water from the Tap Matters
For many people in growing towns across Africa and beyond, turning on a tap or drawing water from a nearby spring is a daily act of trust. The water may look clear and taste fine, but that does not always mean it is safe. This study explores how clean, or contaminated, drinking water really is in Ishaka Subcounty in western Uganda, and shows how modern mapping tools can reveal hidden health risks that ordinary testing might miss.
Many Sources, One Basic Need
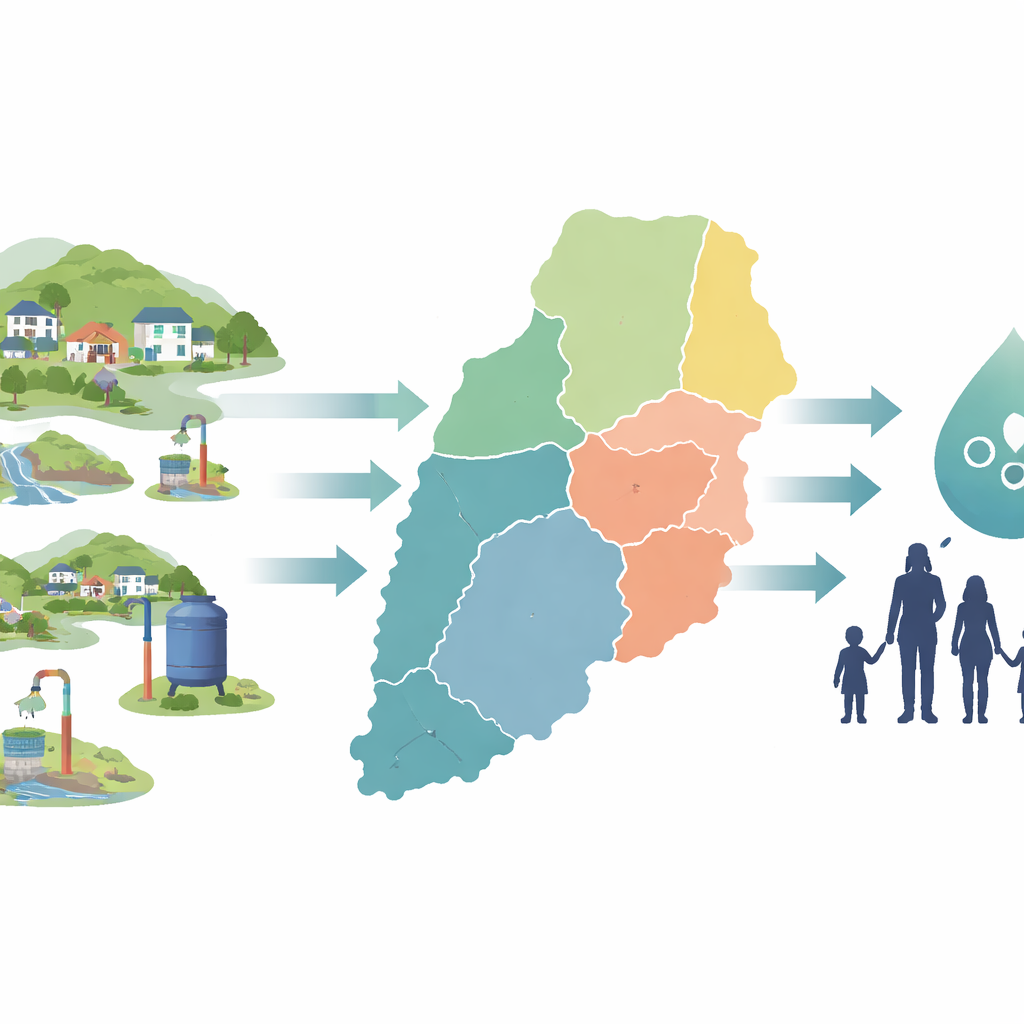
Ishaka Subcounty is a patchwork of busy streets, crowded neighborhoods, and more rural edges. People here rely on many different water sources: piped water from the national utility, boreholes, shallow wells, protected and unprotected springs, and rainwater. On paper, Uganda has made strong progress in providing "improved" water sources. Yet residents still report interruptions in supply and worries about safety, pushing families to use whatever source is close and flowing. The central question of this research was straightforward but urgent: how does water quality actually vary from place to place across this mixed urban–peri-urban landscape, and what does that mean for people’s health?
Looking Beyond Clear Water
The researchers collected 49 water samples from both surface water and groundwater across the subcounty. In the lab they measured common chemical features of water—such as acidity (pH), salts and minerals, particles, temperature, and oxygen—as well as telltale germs, especially faecal coliforms and Escherichia coli, which signal contamination from human or animal waste. They compared their measurements against guidelines from the World Health Organization and Uganda’s own standards body. At first glance, the results might seem reassuring: for most samples, the chemical measures were within recommended limits, and levels of nitrates and dissolved minerals were generally low.
Invisible Germ Hotspots
When the team turned to the germs in the water, the picture changed dramatically. Many samples contained faecal coliforms and E. coli at levels that clearly indicate unsafe water, even when the same samples looked chemically fine. To understand where these risks were concentrated, the scientists used Geographic Information Systems (GIS) to turn point measurements into smooth maps, using a method called thin plate spline interpolation. These maps revealed distinct pockets of microbial contamination—hotspots—rather than a uniform spread. In some places, suspended particles in the water and low oxygen levels lined up with higher germ counts, suggesting that disturbed, murky water and decaying organic matter help microbes survive and spread.
Maps that Guide Action
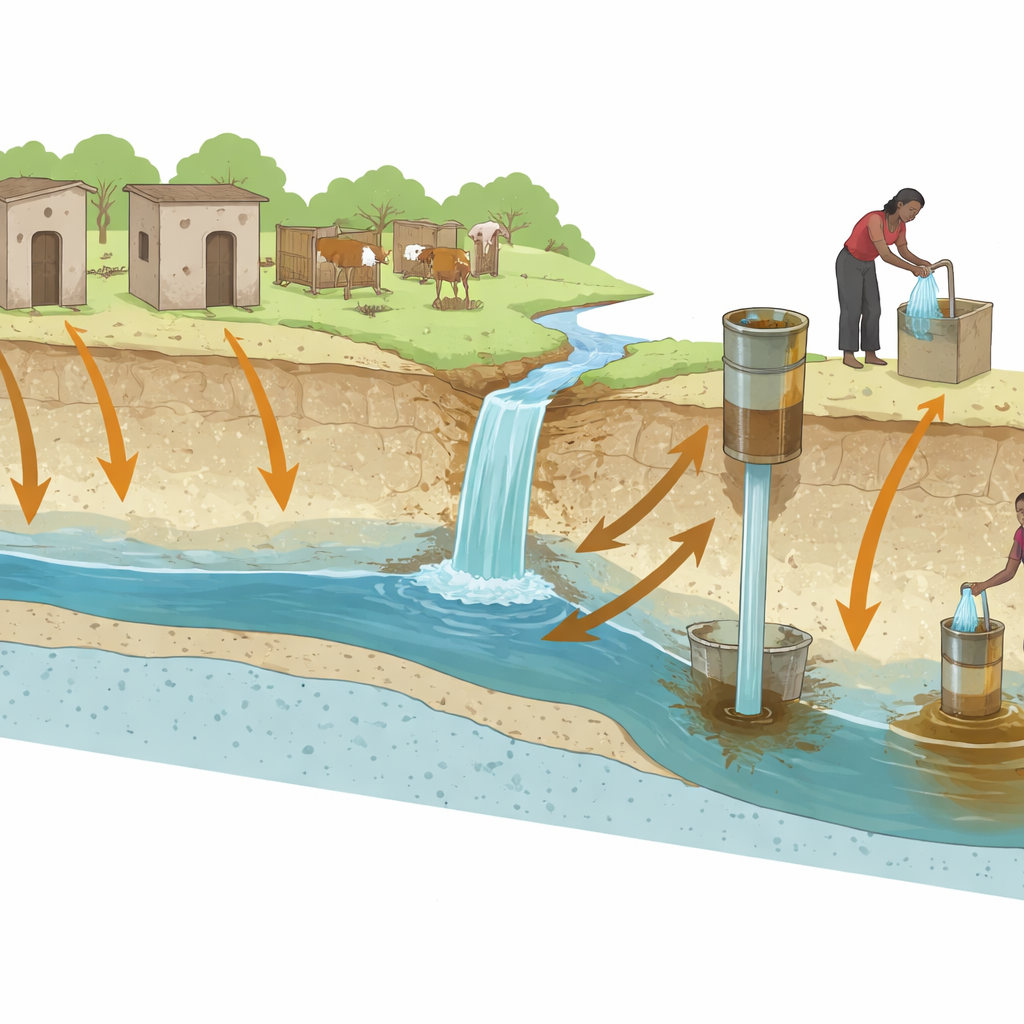
By layering water test results onto maps of Ishaka, the study shows which neighborhoods and sources are most at risk, and where chemical stability masks underlying biological danger. Areas with mildly acidic water hint at metal corrosion risks, while zones of high suspended solids and low oxygen point to physical and biological stress. Yet it is the clustered presence of faecal bacteria that stands out as the most serious threat, especially in communities dependent on shallow wells, springs, and other sources close to pit latrines, livestock, and runoff. The maps do not predict exact values at every point, but they give decision-makers a powerful visual guide to prioritize inspections, treatment, and sanitation upgrades where they are likely to save the most lives.
What It Means for Families
For a layperson, the main takeaway is simple but unsettling: water that looks clear and meets chemical standards can still carry dangerous germs. In Ishaka Subcounty, the greatest risk to health comes not from salts or nutrients, but from faecal contamination that is patchy and often hidden. The study shows that combining regular water testing with smart mapping can uncover these invisible threats and support targeted solutions, from chlorination and boiling campaigns to better latrine placement, source protection, and more reliable piped supplies. In short, safe drinking water is not just about pipes and pumps; it depends on understanding where contamination comes from, how it moves through the landscape, and where people are most exposed—knowledge that this research helps to provide.
Citation: Mohamed, A.A., Kannapiran, A., Suliman Badawi, A.M. et al. Geospatial analysis of surface water and groundwater quality using GIS in Ishaka subcounty, Bushenyi District, Uganda. Sci Rep 16, 11549 (2026). https://doi.org/10.1038/s41598-026-43003-y
Keywords: drinking water safety, microbial contamination, groundwater, GIS mapping, Uganda