Clear Sky Science · en
Pharmacophore-driven kinase profiling applied to the PKIS2 chemogenomic dataset
Why this matters for future medicines
Many modern medicines work by blocking enzymes called kinases, which act like on–off switches in our cells. But most drug molecules do not hit just one switch; they flip several at once, which can be both useful and dangerous. This study introduces a new way to read the hidden “shape code” that makes molecules stick to particular kinases, using a very large public dataset of kinase inhibitors. The approach could help researchers design drugs that are better aimed—either narrowly selective or purposefully multi-target—by understanding which 3D patterns in a molecule tend to switch on which kinases.
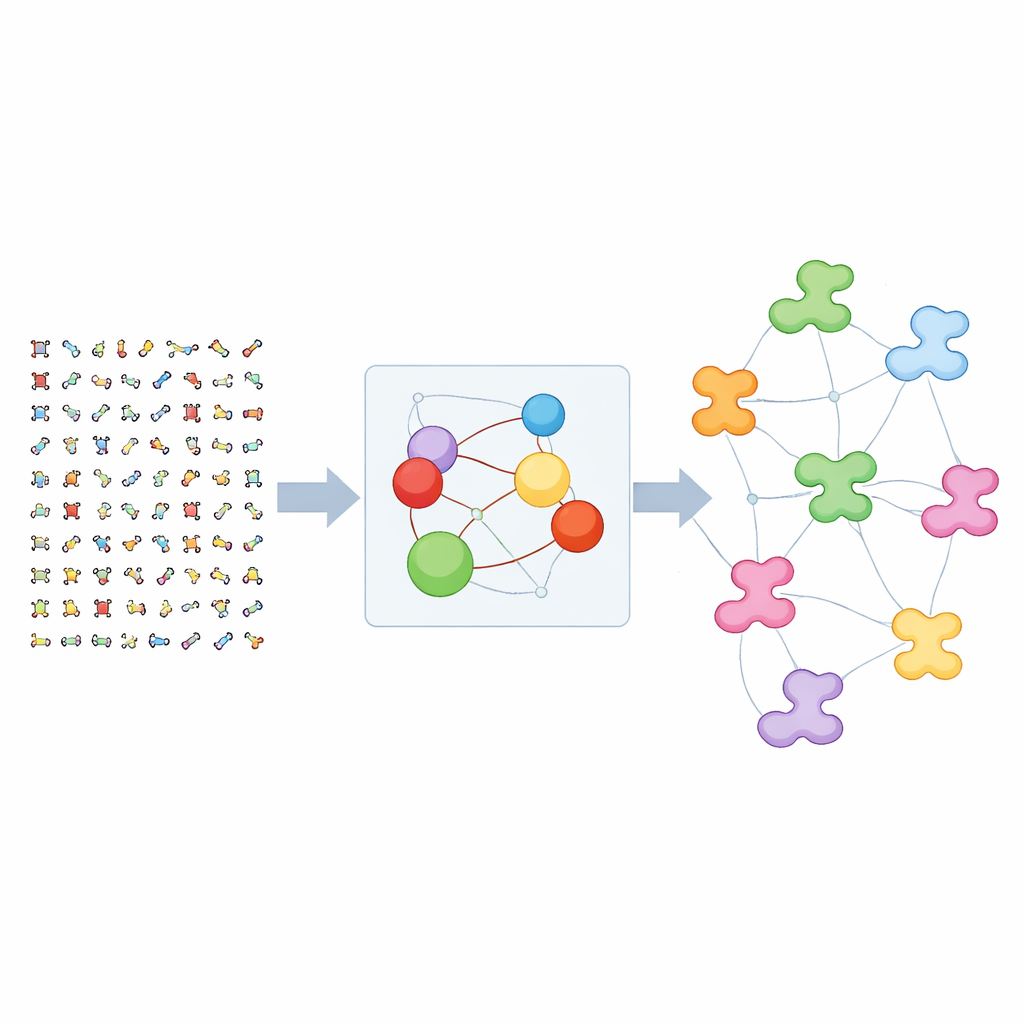
Finding common shapes in a sea of molecules
The authors start from PKIS2, a chemogenomic collection of 645 small molecules tested on 406 human kinases. Instead of handpicking a few example compounds for each kinase, they let the data speak for itself. For every molecule, they generate multiple possible 3D shapes and translate each into a simple map of key features that often drive binding, such as hydrogen-bonding spots, charged groups, hydrophobic regions, and aromatic rings. These maps, called pharmacophores, capture the relative positions of these features in space without relying on detailed chemistry. By mining thousands of such maps across all compounds, the team automatically extracts recurring 3D patterns—“pharmacophore hypotheses”—that appear in many different molecules.
Scoring which shapes matter for which kinases
A central challenge is deciding which pharmacophore patterns are truly linked to biological activity and which are just statistical noise. The researchers introduce a new score, the Normalized Enrichment Measure (NEM), that compares how often compounds matching a given pharmacophore are active on a kinase to how often any compound in the dataset is active on that same kinase. Unlike older measures, NEM corrects for the fact that some kinases are hit by many compounds and others by very few, so patterns can be judged fairly across the panel. They focus on pharmacophores of moderate complexity, typically involving four or five features, which still cover almost all molecules but avoid rare, overly specific patterns.
Revealing shared and selective kinase profiles
By applying NEM to every pharmacophore–kinase pair, the study builds a rich map of how 3D feature patterns relate to kinase activity. For each pharmacophore, they can see which kinases it tends to activate, and for each kinase, which pharmacophores best describe its active ligands. Using an automatic selection procedure, they boil thousands of candidates down to compact sets of representative pharmacophores. For the kinase DDR1, an emerging cancer target, eleven such 3D patterns explain a majority of its active compounds and show a strong bias toward the larger family of tyrosine kinases, matching known biology. Similar analyses for VEGFR2, a key blood-vessel growth receptor, reveal another cluster of pharmacophores enriched in tyrosine kinases and reproduce known multi-kinase profiles of drugs like dasatinib and sorafenib.
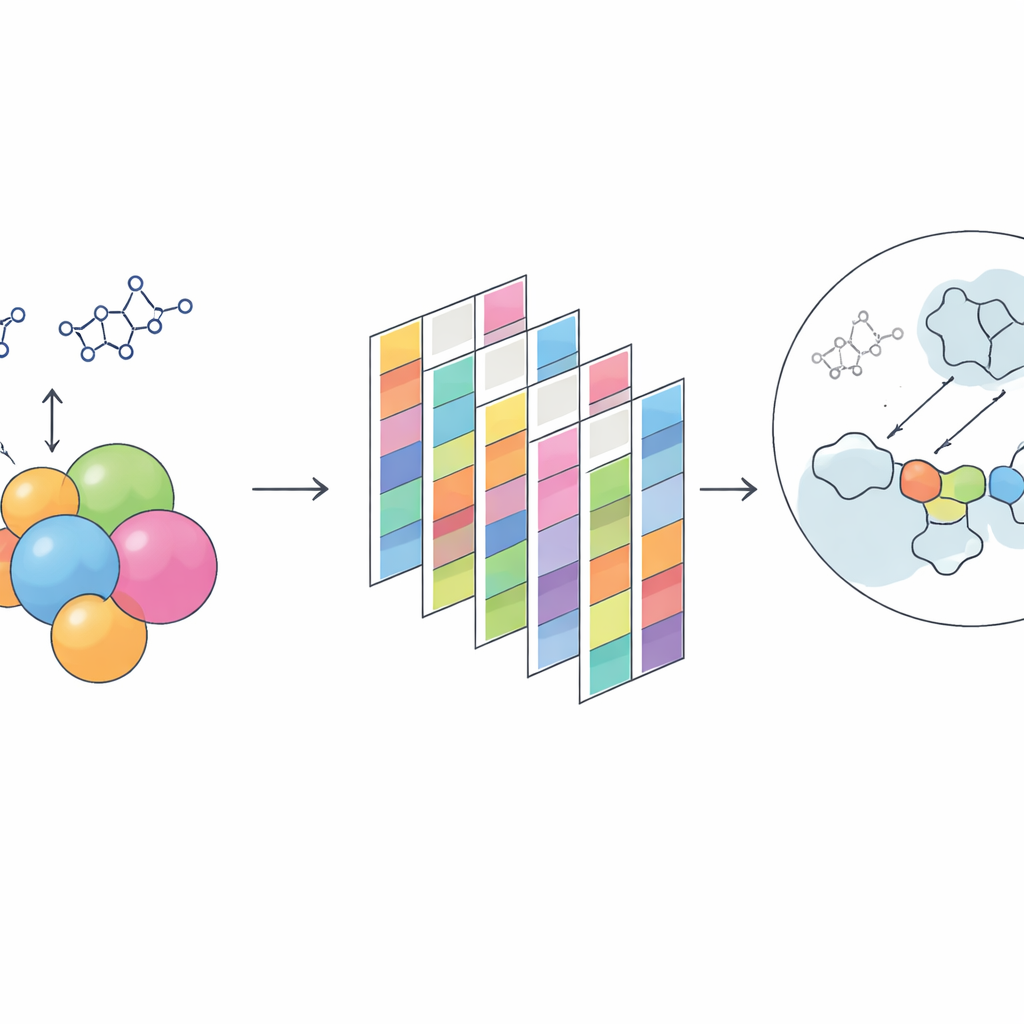
Cross-checking against real-world drug data
To test whether these abstract patterns are meaningful beyond a single dataset, the authors project them onto several large public resources: ChEMBL, DrugBank, KLIFS, KINOMEscan, Kinobeads, and the LINCS program. Many pharmacophores extracted from PKIS2 also match thousands of kinase ligands in ChEMBL and appear in 3D structures where inhibitors are bound to kinases in the Protein Data Bank. For well-studied drugs, the pharmacophore-based predictions line up with experimentally measured multi-kinase profiles. The team even shows that by combining NEM scores with simple logical rules—such as selecting pharmacophores that are strong for DDR1 but weak for VEGFR2—they can carve out patterns that favor one kinase profile over another, hinting at a practical route to control selectivity.
From pattern maps to smarter kinase design
In plain terms, this work builds a kind of “map legend” for kinase drug discovery: it tells us which simple 3D feature arrangements in small molecules tend to light up which kinases, across many datasets. Because the method is unsupervised, scalable, and released as open-source software, it can be applied to any new screening panel. Chemists can use it to screen virtual libraries, predict which kinases a new molecule is likely to hit, and identify which parts of a scaffold drive broad activity or sharp selectivity. Over time, combining these pharmacophore maps with modern machine-learning models could help steer the design of safer, more effective kinase drugs by making the complex landscape of polypharmacology more understandable and predictable.
Citation: Bureau, R., Lamotte, JL., Cuissart, B. et al. Pharmacophore-driven kinase profiling applied to the PKIS2 chemogenomic dataset. Sci Rep 16, 12083 (2026). https://doi.org/10.1038/s41598-026-42945-7
Keywords: kinase inhibitors, pharmacophore modeling, polypharmacology, chemogenomics, drug design