Clear Sky Science · en
Polarity-resolved far-side magnetograms based on helioseismic measurements
Why Watching the Sun’s Hidden Side Matters
Space weather storms from the Sun can disrupt satellites, power grids, and radio communications on Earth. These storms are driven by active regions—patches of intense magnetism—on the Sun’s surface. We see the half of the Sun facing Earth very clearly, but for the other half we are effectively blind. This study presents a new way to infer not just the presence, but also the magnetic structure and polarity (north–south orientation) of active regions on the Sun’s far side, using subtle vibrations of the solar surface combined with spacecraft measurements. This brings us closer to having a full 360-degree magnetic map of the Sun in near real time.
Listening to the Sun’s Interior
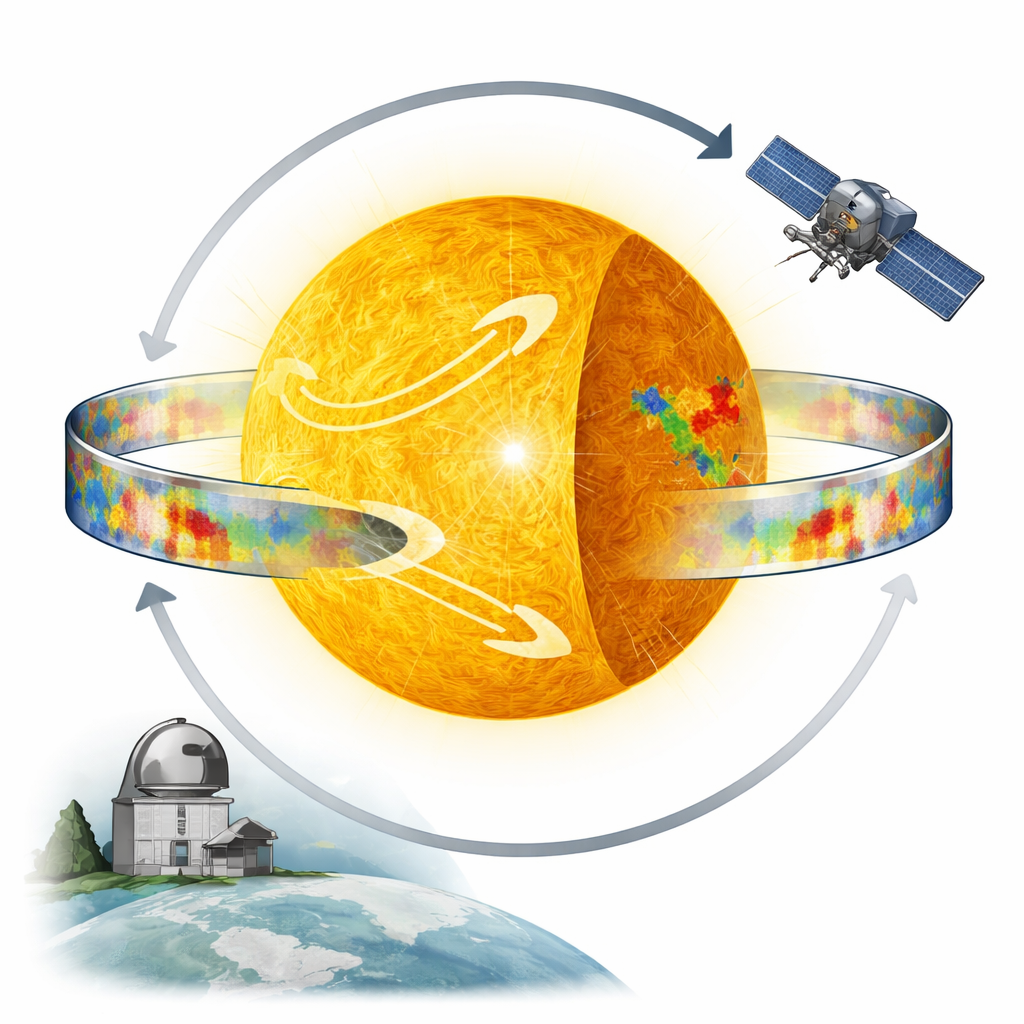
The Sun constantly rings with sound waves that bounce around its interior. When these acoustic waves travel through magnetically active regions, their travel times are slightly delayed. Networks of telescopes on Earth, such as the Global Oscillation Network Group (GONG), record these surface motions and use "helioseismic holography" to reconstruct how the waves have been perturbed on the far side. For more than two decades, these techniques have revealed where strong far-side active regions exist, but they could not reliably tell scientists which parts of those regions were positive or negative in magnetic polarity. That missing information is crucial for modeling how the Sun’s magnetic field extends into space and for predicting the paths of solar eruptions.
Turning Seismic Ripples into Magnetic Maps
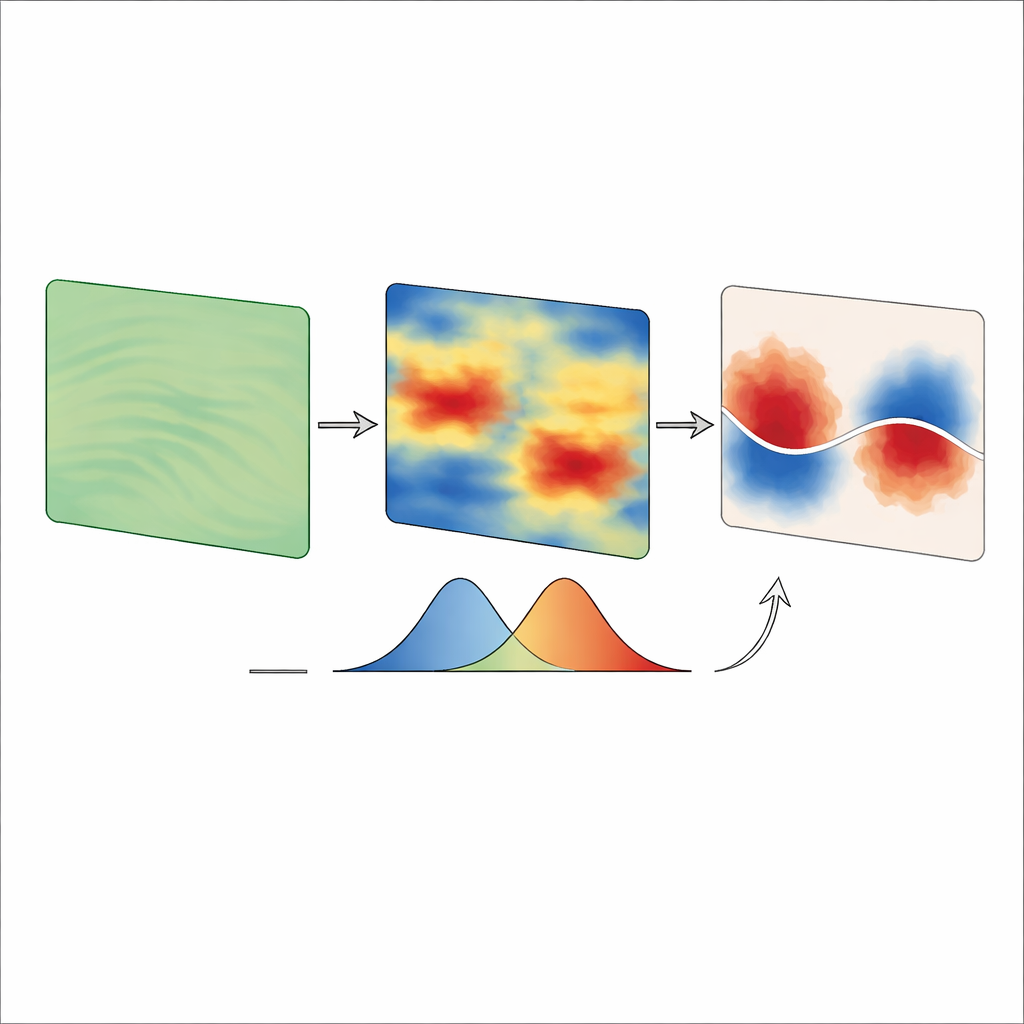
To bridge this gap, the authors combine helioseismic data from GONG with direct magnetic measurements from the Solar Orbiter spacecraft’s SO/PHI instrument, which occasionally views large portions of the Sun’s far side. They assemble a three-year dataset (2022–2024) in which far-side seismic maps and far-side magnetograms overlap in both space and time. A machine-learning system called FASTARR first identifies the outlines of far-side active regions in the seismic maps. Within those outlines, the team compares the strength of the seismic phase shifts—the tiny timing changes in the waves—with the measured magnetic field strength. By analyzing hundreds of thousands of pixels across 190 active regions, they show that the seismic signal follows a stable, nonlinear relationship with the underlying magnetic field: the phase shift grows rapidly with increasing field in weak regions, then gradually saturates for stronger fields. This calibrated curve allows them to convert any far-side seismic map into an approximate map of magnetic field strength.
Finding the Magnetic Plus and Minus
Knowing how strong the magnetism is is only half the battle; space-weather models also need to know how the magnetic field is oriented. The team exploits a simple but powerful pattern: most active regions have two main magnetic lobes of opposite sign that sit side by side. When they look at how the inferred magnetic strength varies along the length of a region, they often see a clear double-peaked profile—one peak for each lobe. By rotating each region to its best alignment and fitting two smooth humps to this profile, they can infer where the boundary between polarities lies and which side is "leading" or "trailing" in the direction of solar rotation. They then combine this geometric information with Hale’s polarity rule—a well-tested pattern that tells which polarity should lead in each hemisphere during a given solar cycle—to assign positive and negative signs continuously across the region. The result is a smooth, polarity-resolved magnetic map of the far-side region that can be directly compared to SO/PHI magnetograms.
Putting the Method to the Test in a Major Storm
The authors test their approach on a dramatic episode from May 2024, when a cluster of large active regions produced intense solar flares and Earth-directed eruptions that led to one of the strongest geomagnetic storms of Solar Cycle 25. As key regions rotated out of Earth’s view and onto the far side, their helioseismic technique continued to track the size, strength, and polarity structure of the magnetic complexes. Where Solar Orbiter provided direct far-side magnetograms, the reconstructed maps agreed well with the observed shapes and polarity patterns, capturing how the regions fragmented and weakened over time. Quantitative comparisons show that the method reproduces the relative strength and sign of the magnetic field with good accuracy, especially in the stronger parts of the regions that matter most for space weather.
A Step Toward Full-Sun Space-Weather Forecasting
In essence, this work shows that careful analysis of the Sun’s vibrations, guided by physical rules and validated by spacecraft, can recover both the strength and orientation of magnetism on the hemisphere we cannot see directly. By turning far-side helioseismic maps into polarity-resolved magnetograms at six-hour cadence, this method can fill a long-standing blind spot in solar monitoring. When combined with traditional front-side magnetograms, it enables more realistic full-Sun inputs for models of the corona and solar wind, improving our ability to anticipate when and how solar storms will affect Earth and the rest of the solar system.
Citation: Hamada, A., Jain, K., Strecker, H. et al. Polarity-resolved far-side magnetograms based on helioseismic measurements. Sci Rep 16, 13110 (2026). https://doi.org/10.1038/s41598-026-42917-x
Keywords: space weather, solar magnetism, helioseismology, solar active regions, Solar Orbiter