Clear Sky Science · en
Temporal dynamics and analysis of pollutant parameters in the water quality entering a reservoir dam
Why this reservoir story matters
Clean water from dams and reservoirs supports drinking supplies, farming, and hydropower for millions of people. Yet the streams that feed these structures quietly carry a mix of mud, nutrients, and toxic metals from human activity upstream. This study follows a decade of water tests at the Sardasht Reservoir Dam in northwest Iran to show how pollution is changing over time, what is driving those changes, and which threats now demand the most urgent attention.
A mountain river under pressure
The Sardasht Dam sits in a rugged, mountainous region and stores water for homes, irrigation, electricity, and flood control. All of that depends on the quality of the river water flowing into the reservoir. From 2014 to 2024, local authorities regularly sampled this inflow for a wide range of features: basic conditions like temperature and salt content, nutrients such as nitrate, organic matter that consumes oxygen, and heavy metals including manganese and lead. The researchers used these records to see how the river’s character is shifting over the years as villages grow, farms expand, and waste from towns and small industries reaches the waterway.
Following the numbers through time
To track long term change, the team relied on statistical tools that can spot steady upward or downward trends, even when sampling dates are irregular. They applied a method known as the Mann Kendall test, together with a measure called Sen’s slope, to each of 18 water quality indicators. They then visualized these records with time series charts, box plots, and violin plots, as well as probability curves that reveal how often different values occur. These graphics helped distinguish normal day to day variation from the rarer spikes that hint at brief but intense pollution events.
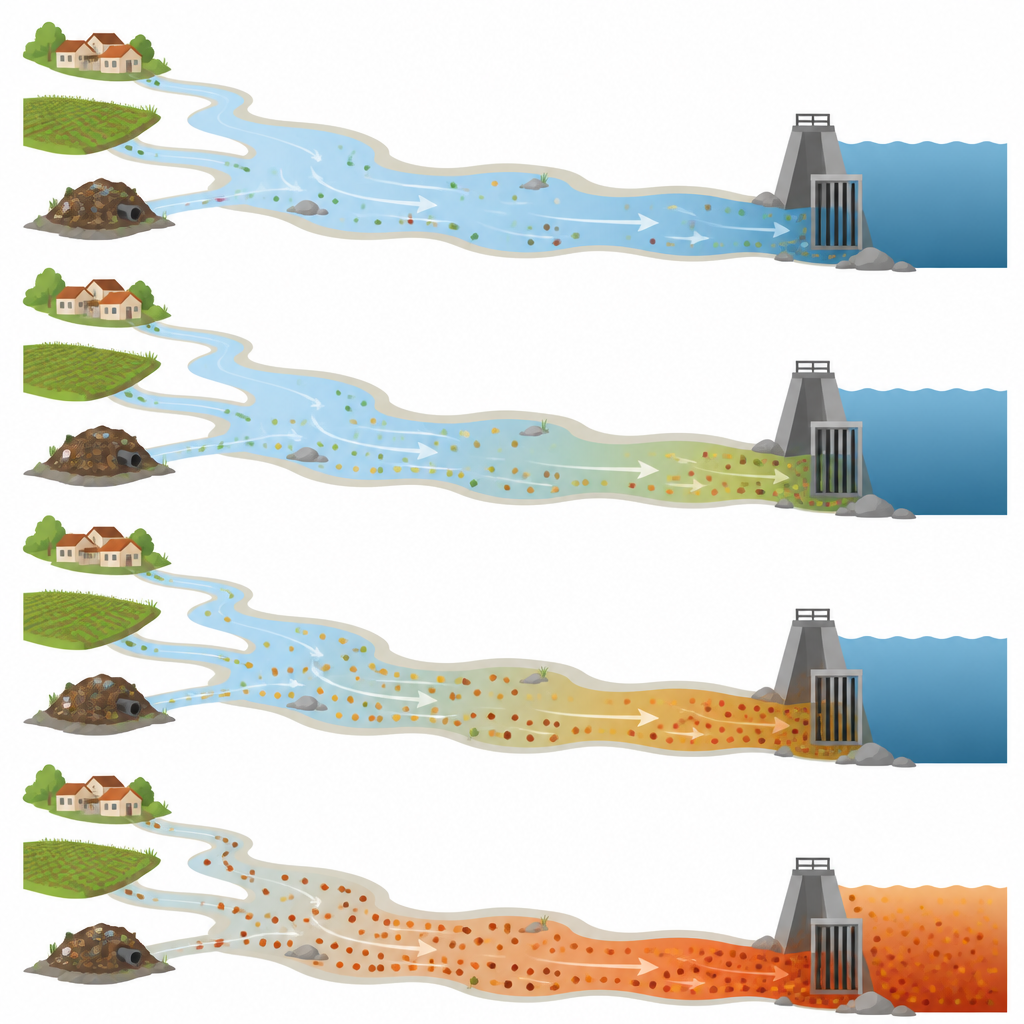
What is getting worse and what is staying steady
The clearest warning sign was a steady rise in chemical oxygen demand, or COD, which reflects the load of organic substances in the water. COD increased by roughly one milligram per liter per decade and showed a statistically reliable upward trend. Water temperature and manganese levels also edged upward, though with more uncertainty. In contrast, many other measures, including dissolved oxygen, acidity level, and total dissolved solids, remained fairly stable. However, several pollutants, especially nitrate and lead, showed sharp peaks at certain times. These bursts likely coincide with spring rains washing fertilizer from fields, sewage from riverside villages, and waste from scattered industrial and dumping sites into the river.
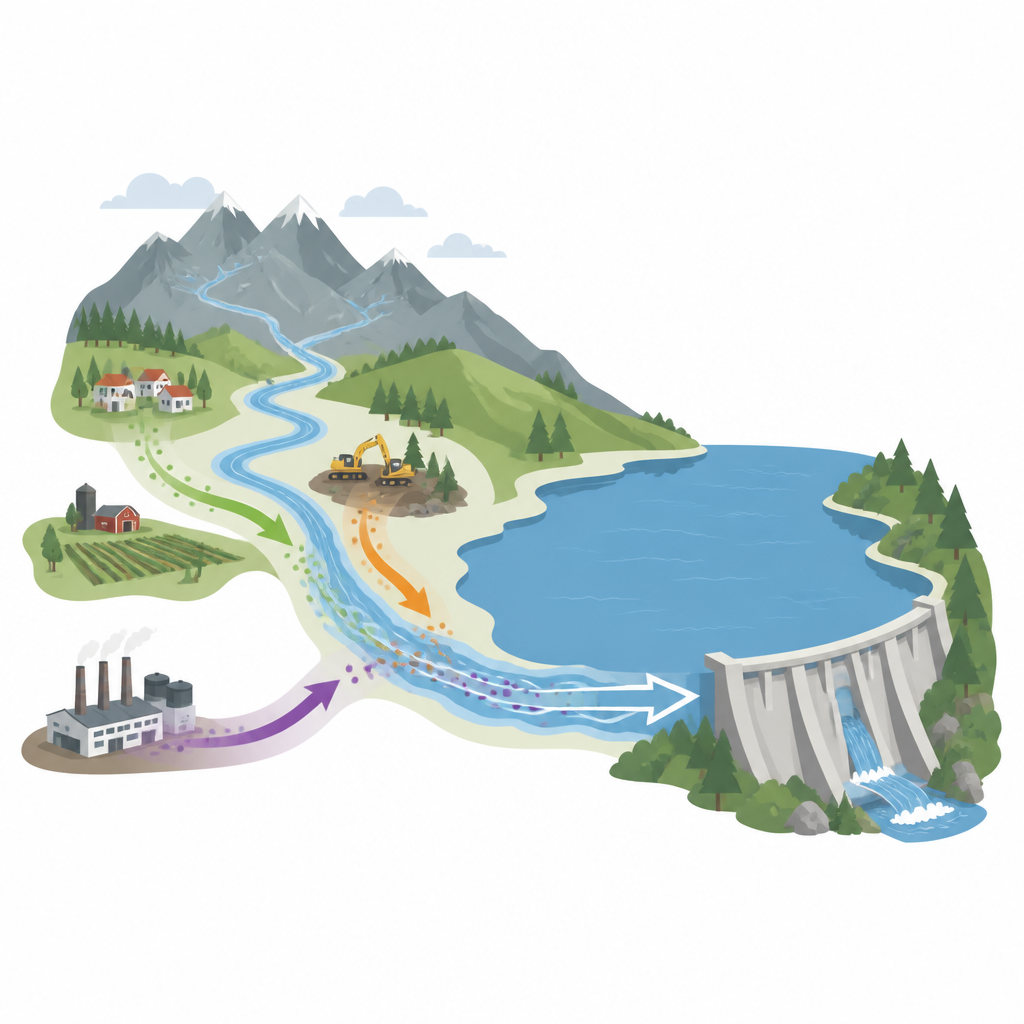
From village drains to reservoir risks
Field visits connected the numbers to real world sources. In several upstream villages, almost all household wastewater, including toilet discharge, runs directly into the river or leaches from shallow soak pits. Towns such as Sardasht, Mirabad, and Nalas lack full sewage treatment and contribute both organic matter and nutrients. Farms along the river add fertilizer and manure, while poorly managed waste dumps and sand and gravel operations introduce sediment and metals. When rainstorms hit these areas, polluted runoff surges toward the dam, raising COD, nitrate, manganese, and lead at the inflow. Comparisons with national and World Health Organization guidelines showed that average and peak manganese and lead levels often exceeded recommended limits, signaling potential health risks and higher costs for treating water drawn from the reservoir.
Plans for cleaner water ahead
The authors argue that the Sardasht dam cannot be managed safely by watching water quantity alone. Their results point to the need for new sewage treatment plants in nearby towns and villages, tighter control of waste disposal and small industries, and better farming practices that reduce runoff. They also stress the importance of consistent, year round monitoring to capture seasonal pulses of pollution more clearly and to refine trend estimates. In simple terms, the study shows that while some aspects of the river’s quality remain stable, rising organic pollution, warming water, and recurring metal spikes are already shaping the future of this reservoir and must be tackled now to keep its water safe and useful.
Citation: Mostafazadeh, R., Irani, T., Mousavi Moghanjoghi, S. et al. Temporal dynamics and analysis of pollutant parameters in the water quality entering a reservoir dam. Sci Rep 16, 14990 (2026). https://doi.org/10.1038/s41598-026-42878-1
Keywords: water quality, reservoir pollution, Sardasht Dam, river monitoring, heavy metals