Clear Sky Science · en
HyMSS-GAD: a hybrid multi-stage framework for multi-view graph anomaly detection with structural, contextual, and geometric reasoning
Why spotting odd patterns in networks matters
From social media and shopping sites to financial systems and biology, much of today’s data can be described as networks: dots (nodes) connected by lines (links). Hidden within these webs are rare, unusual patterns that may signal fraud, cyberattacks, faulty scientific records, or unexpected scientific discoveries. The paper introduces HyMSS-GAD, a new method that looks for such anomalies by combining three different ways of “looking” at a network at once: what each node is like, how it is wired to others, and how it fits into the broader shape of the network. This blend aims to catch subtle warning signs that older tools miss and to explain why a node is suspicious.
Seeing more than one side of a network
Traditional methods for finding odd nodes in graphs usually assume that connected nodes are similar. This “birds of a feather flock together” rule works in some social or citation networks, but breaks down when connections link very different types of entities, as in many real systems. Older models also tend to focus on either the pattern of links or the attributes of nodes, but not both together, and often squash all information into a single view. HyMSS-GAD starts from the idea that anomalies show up as disagreements between several views of the same node: its descriptive features, its position in small local wiring patterns, and its role in the overall shape of the network.
Learning when content and neighborhood disagree
The first stage of HyMSS-GAD looks for “contextual” oddities: nodes whose content does not match what their neighbors suggest. For every node, the method builds a tiny local network around it, then learns two parallel descriptions: one based on its attributes (such as words in a paper or product details) and one based on how it connects. A self-supervised learning scheme encourages these two descriptions to agree for normal nodes and to disagree for strange ones, without needing labeled examples. Large mismatches between the node and its neighborhood become a numerical residual that signals contextual anomaly.
Reading the small patterns in the wiring
The second view focuses on the fine-grained structure of the graph. Instead of just counting how many neighbors a node has, HyMSS-GAD measures how often it appears in small wiring motifs such as triangles, stars, or short loops. These counts form a “motif profile” for each node. A compact neural network learns how typical motif profiles look and tries to reconstruct them; nodes whose motif profiles are hard to reconstruct receive high structural residuals. This captures cases where a node plays a strange structural role—say, sitting in too few triangles in a tightly clustered region, or forming rare connection patterns that do not match its surroundings.
Following the curves of the network
Beyond local neighborhoods, the method examines the broader “shape” of the network using a concept called curvature. In simple terms, curvature measures whether two linked nodes live in similar or very different surroundings. Edges inside tight communities tend to have higher curvature, while edges that bridge separate regions or lie at boundaries have lower or even negative curvature. HyMSS-GAD learns to reconstruct precomputed curvature values from its fused node descriptions. When it fails to do so for edges around a node, that node receives a high geometric residual, marking it as a possible bridge, bottleneck, or boundary node that does not fit the usual global pattern.
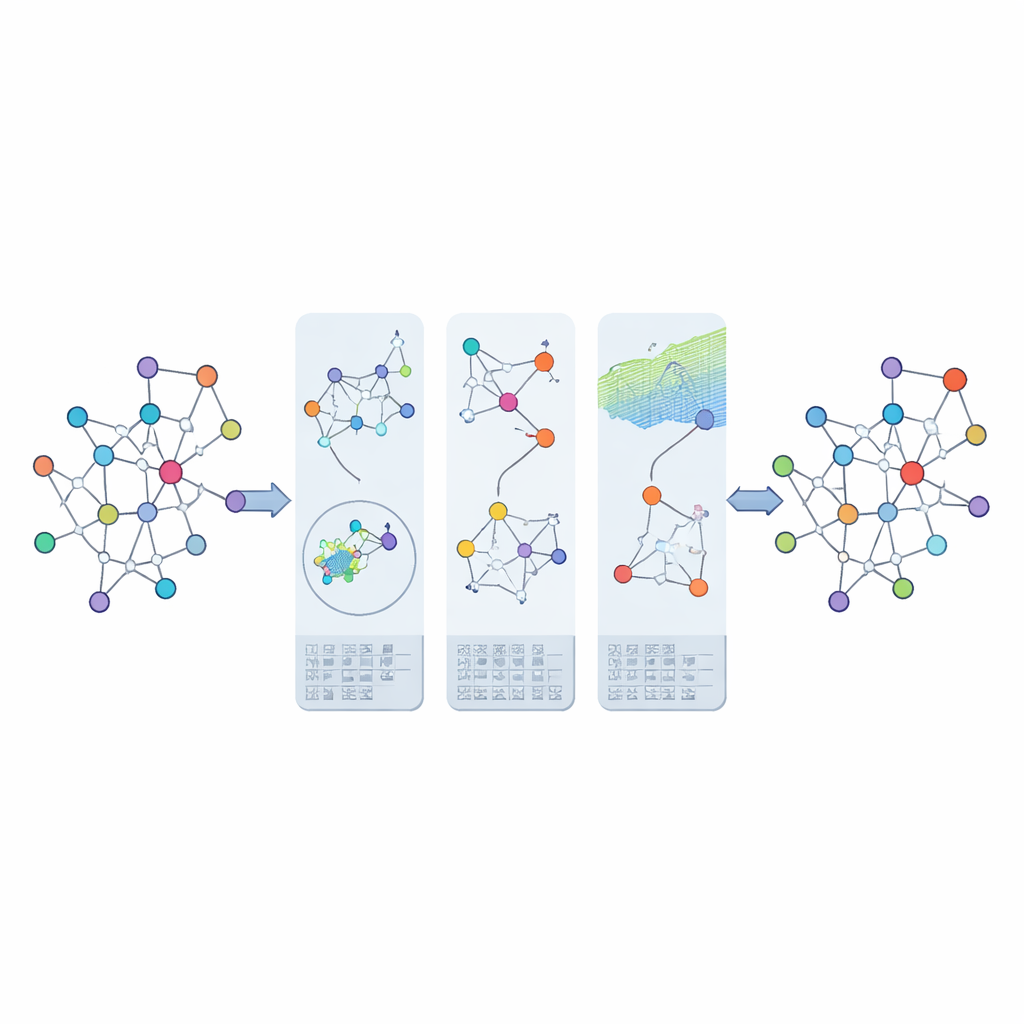
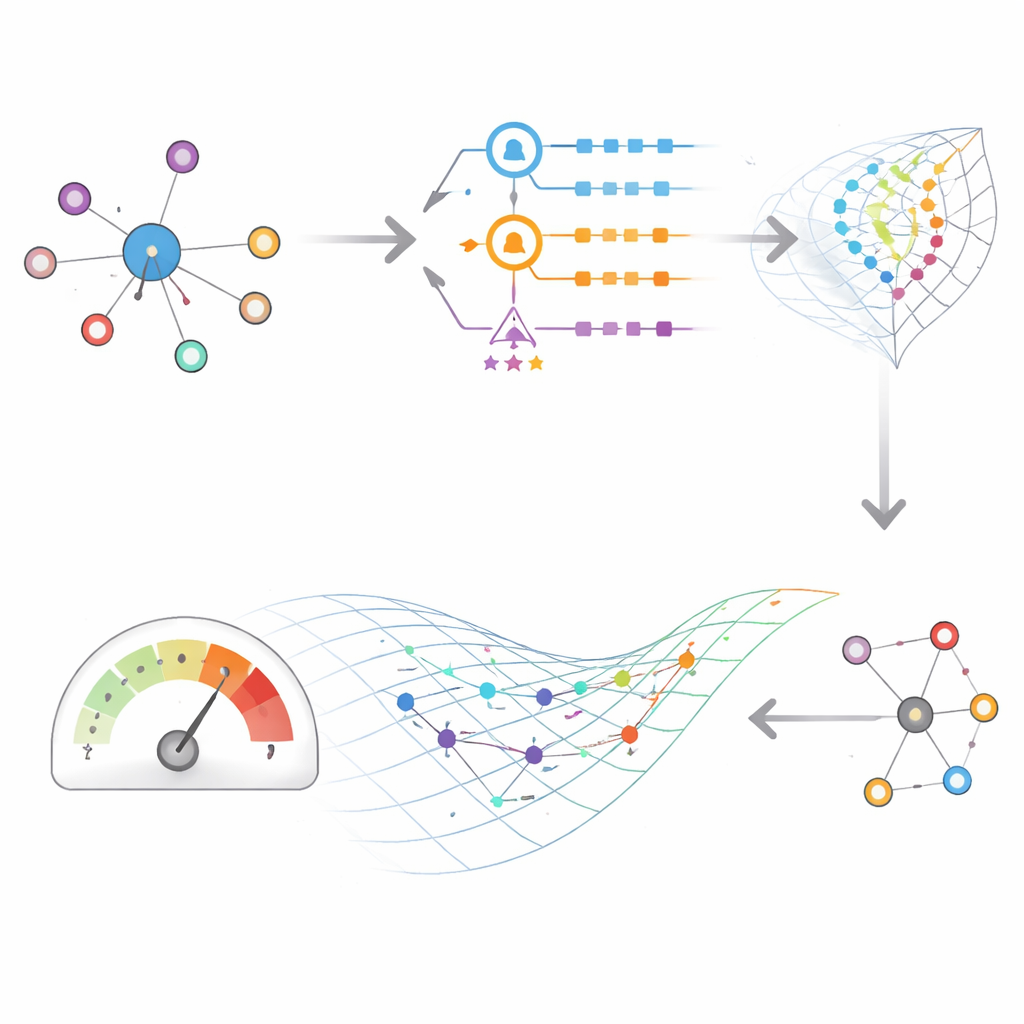
Bringing the clues together
To avoid treating each type of signal as equally important everywhere, HyMSS-GAD uses an attention mechanism that lets each node “decide” how much weight to give to contextual versus structural information before the curvature step. Finally, the method combines three residuals—contextual, structural, and geometric—into a single anomaly score. Crucially, it also keeps these components separate, so an analyst can see whether a node is flagged mainly because of mismatched content, unusual wiring, or an odd geometric position. Tests on several standard datasets, including citation and e-commerce graphs, show that this multi-view, residual-based approach not only outperforms leading alternatives, but also offers clearer explanations of why certain nodes stand out.
Citation: Khan, W., Ebrahim, N., Elloumi, M. et al. HyMSS-GAD: a hybrid multi-stage framework for multi-view graph anomaly detection with structural, contextual, and geometric reasoning. Sci Rep 16, 12108 (2026). https://doi.org/10.1038/s41598-026-42823-2
Keywords: graph anomaly detection, network analysis, machine learning, graph neural networks, multimodal data