Clear Sky Science · en
Intelligent system for portfolio optimization for novel volatility forecasting using machine learning
Why smarter investing matters
Anyone who has watched their savings rise and fall with the stock market knows that big losses can feel worse than modest gains feel good. This paper tackles a question that matters to everyday investors and large institutions alike: can we use modern artificial intelligence to shape portfolios that not only grow over time, but also better withstand sharp market drops across many countries?
From classic theory to data-hungry machines
Traditional portfolio theory, dating back to Harry Markowitz in the 1950s, teaches investors to balance risk and return by spreading their money across different assets. Over the past decade, more complex approaches based on deep learning and reinforcement learning have promised to squeeze extra gains from financial data. Yet these newer methods are often hard to interpret, expensive to run, and difficult to trust across many different markets. Crucially, most focus on predicting returns, while professional risk managers care deeply about drawdowns—the size of the worst peak-to-trough losses along the way.
Looking at market pain instead of just market gain
The authors shift attention from forecasting short-term returns to forecasting how severe losses can become. They study 40 stock markets, from developed economies like the United States and Germany to emerging markets such as Brazil and South Africa, over a 20-year period from 1999 to 2018. For each country and year, they compute widely used risk-adjusted performance measures: the Sharpe ratio (return per unit of overall risk), the Sterling ratio (return relative to average past losses), and the Calmar ratio, which directly relates annual gains to the worst drawdown. These ratios are then grouped into simple “high,” “medium,” and “low” categories that indicate how attractive or fragile a market looks from a risk–reward perspective.
How the intelligent system actually works
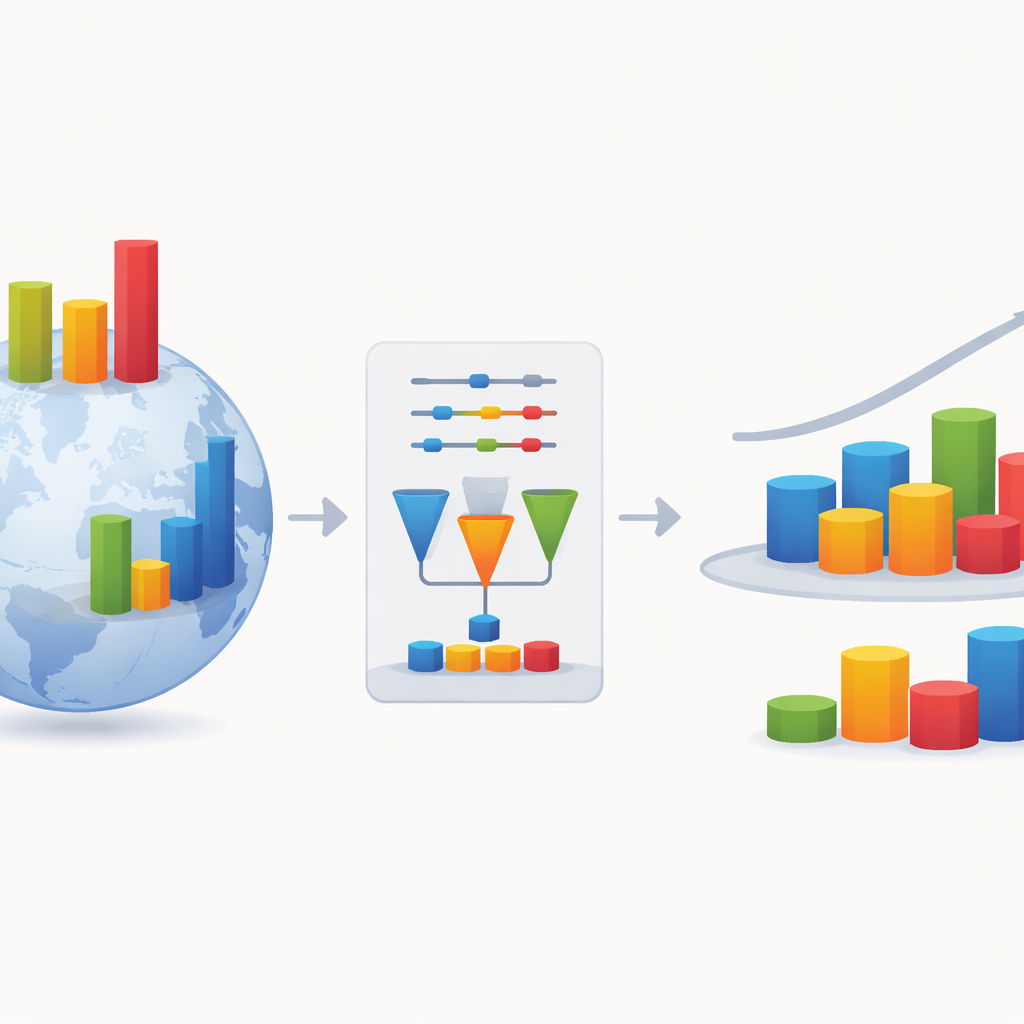
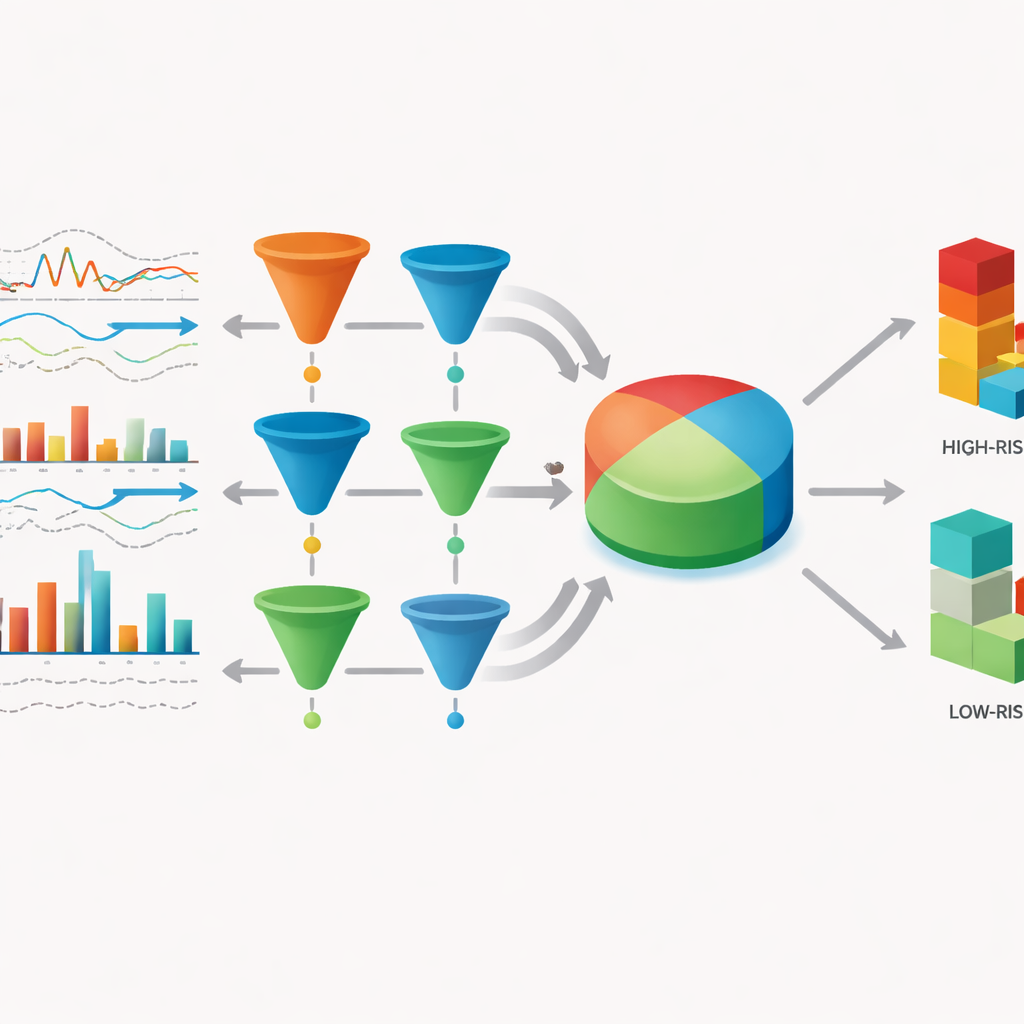
Under the hood, the proposed system is careful data plumbing plus a structured machine-learning model called a multi–Support Vector Machine (multi-SVM) classifier. First, the team cleans and reshapes two decades of stock data from Bloomberg, removing bad entries, filling short gaps, and normalizing scales so that a small market and a large market can be compared fairly. They then engineer features that summarize each market’s behavior, including the highest, lowest, and average share values, volatility, yearly returns, and rolling three-year drawdowns. These features become the inputs to several SVM sub-models, each specializing in one of the key ratios, and all using a non‑linear kernel to capture complex links between risk and reward. A fusion step then combines the sub-models’ confidence levels into a single judgment about whether a given country-year belongs in a high-, medium-, or low-quality risk-adjusted category.
Turning predictions into portfolio choices
To see whether this intelligence actually helps investors, the authors run a long historical “what if” experiment. Each year, they imagine building a global portfolio that gives extra weight to markets their system labels as high quality, neutral weight to medium markets, and reduced weight to low-quality ones. They compare the results to three well-known benchmarks: a simple market model (CAPM), an equally weighted global portfolio, and the popular three-factor model developed by Fama and French. Over the 1999–2018 period, the multi-SVM guided portfolio delivers the highest cumulative return, the smallest worst loss, and the strongest Sharpe ratio. The classifier itself correctly places markets into their risk–reward categories about 97.5% of the time, a clear improvement over a single SVM and over a basic Naïve Bayes model.
What this means for investors and the future
For a non-specialist, the key takeaway is that the authors do not invent a new black-box trading robot; instead, they carefully combine established tools to focus on what investors fear most—large, sustained losses. By centering the model on drawdown‑related measures and keeping the structure relatively transparent, they provide a practical way to guide global portfolio weights that is easier to explain than many deep learning systems, yet still competitive in performance. The study suggests that intelligently classifying markets by their risk-adjusted health, rather than just chasing raw returns, can lead to portfolios that grow more steadily and suffer milder shocks, offering a more comfortable ride through turbulent markets.
Citation: Biswas, T., Dey, A., Mandal, G. et al. Intelligent system for portfolio optimization for novel volatility forecasting using machine learning. Sci Rep 16, 14670 (2026). https://doi.org/10.1038/s41598-026-42813-4
Keywords: portfolio optimization, financial volatility, machine learning in finance, risk management, global stock markets