Clear Sky Science · en
Blind image quality assessment based on statistical features
Why picture quality matters in daily life
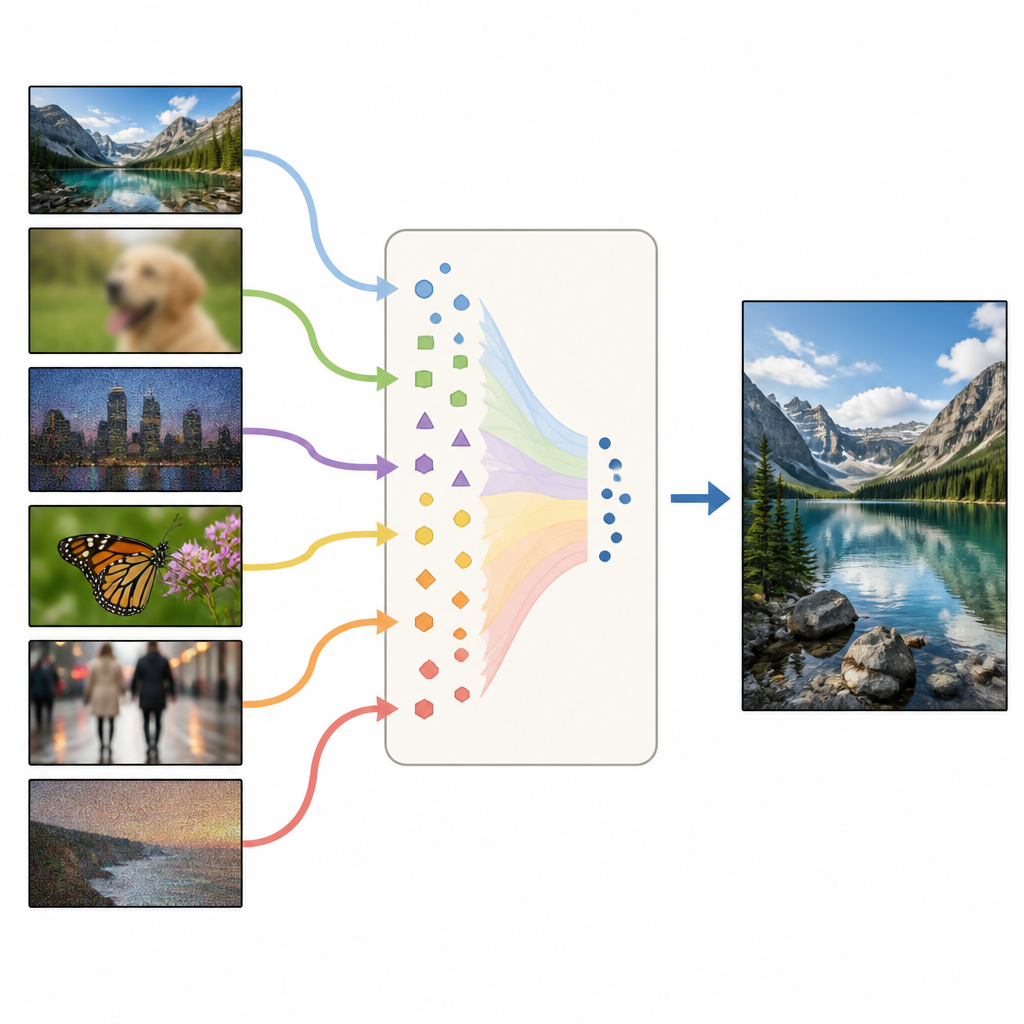
From video calls to medical scans, our world runs on digital pictures. Yet these images are often compressed, transmitted, and filtered in ways that can quietly damage what we see. Before a streaming service, camera app, or hospital system can decide how to store or fix an image, it needs a fast way to judge how good that image looks to a human viewer, even when no perfect “original” is available. This study presents a new way to score image quality that is both efficient and closely tied to how our eyes respond to light and contrast.
Checking quality without a perfect reference
Engineers usually measure image quality by comparing a distorted picture to a flawless original, computing simple differences like mean squared error or peak signal to noise ratio. These numbers are easy to calculate but often disagree with human opinion: small changes can be invisible, some regions matter more than others, and not every change looks like damage. In many real systems, such as photo libraries or live video streams, the original version is missing, so the task becomes “blind” quality assessment: decide how good a single, stand alone image looks, with no reference to compare it against.
Letting natural scenes set the standard
The new method, called BIQABSF, builds on the idea that ordinary photographs of the natural world share stable statistical patterns. Distortions such as blur, noise, or harsh compression disturb these patterns in characteristic ways. Earlier tools, like a widely used method named BRISQUE, tried to capture this by analyzing the brightness values in local regions of the image, after normalizing them so they roughly follow a bell shaped curve. However, BRISQUE assumes that these normalized values are centered exactly around zero, an ideal that does not always hold in real pictures, which can make its estimates less accurate.
Seeing pictures through contrast, not raw brightness
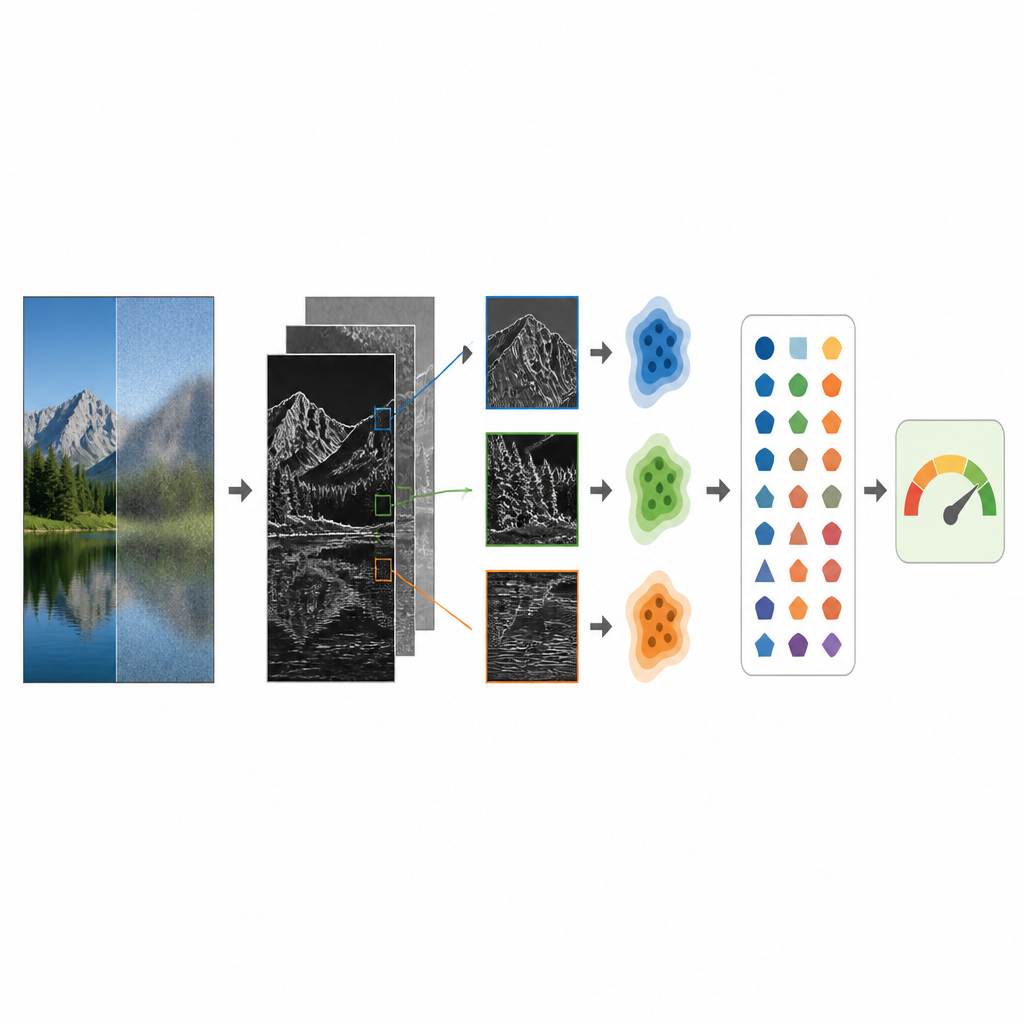
BIQABSF introduces two key changes to better match human vision. First, instead of working directly with brightness, it converts each pixel into a log contrast value that reflects how much brighter or darker it is than the overall image. Our eyes respond roughly in a logarithmic way to light, so this transformation aligns the math with perception and removes dependence on the absolute lighting of the scene. Then, in each small neighborhood of the image, the method subtracts the local average and divides by the local variation, producing a field of locally normalized contrast values that are far less correlated from pixel to pixel and easier to model statistically.
Capturing subtle statistical fingerprints
Once this normalized contrast map is built, the authors study how its values are distributed across the image. Rather than forcing the distribution to be perfectly symmetric around zero, they fit a more flexible family of curves that can shift and skew, capturing the fact that real images often lean slightly in one direction. They also look at how neighboring contrast values interact along different directions, such as horizontal, vertical, and diagonal pairs. From these fits they extract a compact set of numerical features that summarize the shape, spread, and asymmetry of the data at two different scales. These features are then fed into a support vector regression model, which has been trained on human opinion scores to predict how a typical viewer would rate the image quality.
Putting the method to the test
The team evaluated BIQABSF on several large, well known image databases in which human volunteers had already scored thousands of pictures degraded by blur, noise, compression artifacts, and other distortions. Across four datasets, the new method consistently ranked near the top among “no reference” approaches, often matching or surpassing modern deep learning systems while using far less computation. It also generalized well when trained on one database and tested on another with different mixes of distortions, suggesting that its contrast based statistics capture something fundamental about how real world images look when they are clean or damaged.
What this means for everyday technology
In plain terms, the study shows that by looking at how contrast behaves in an image and modeling its small departures from a neat bell curve, a computer can estimate how good that image looks to people without ever seeing an original. Because BIQABSF is compact, fast, and interpretable, it is well suited for practical roles such as monitoring the quality of streaming video, guiding camera settings on phones, or flagging low quality medical images before diagnosis. The work suggests that carefully designed statistical features, grounded in the way our eyes work, can still compete with heavy neural networks for judging picture quality in the real world.
Citation: Ji, W., Chen, X. Blind image quality assessment based on statistical features. Sci Rep 16, 14756 (2026). https://doi.org/10.1038/s41598-026-42799-z
Keywords: image quality, blind assessment, natural scene statistics, contrast features, computer vision