Clear Sky Science · en
Noninvasive hemodynamic assessment of aortic coarctation: multimodal imaging based-computational fluid dynamics
Why Narrowed Arteries in the Chest Matter
Some people are born with a tight "pinch" in the body’s main artery, the aorta. This condition, called coarctation of the aorta, forces the heart to pump harder and can lead to high blood pressure in the upper body, poor blood flow to the legs, and serious problems such as stroke or heart failure later in life. Doctors need to know how big a pressure drop this pinch causes, but the most accurate test today involves threading a tube into the heart and arteries. This study explores whether detailed computer models built from routine scans can safely replace most of that invasive testing.
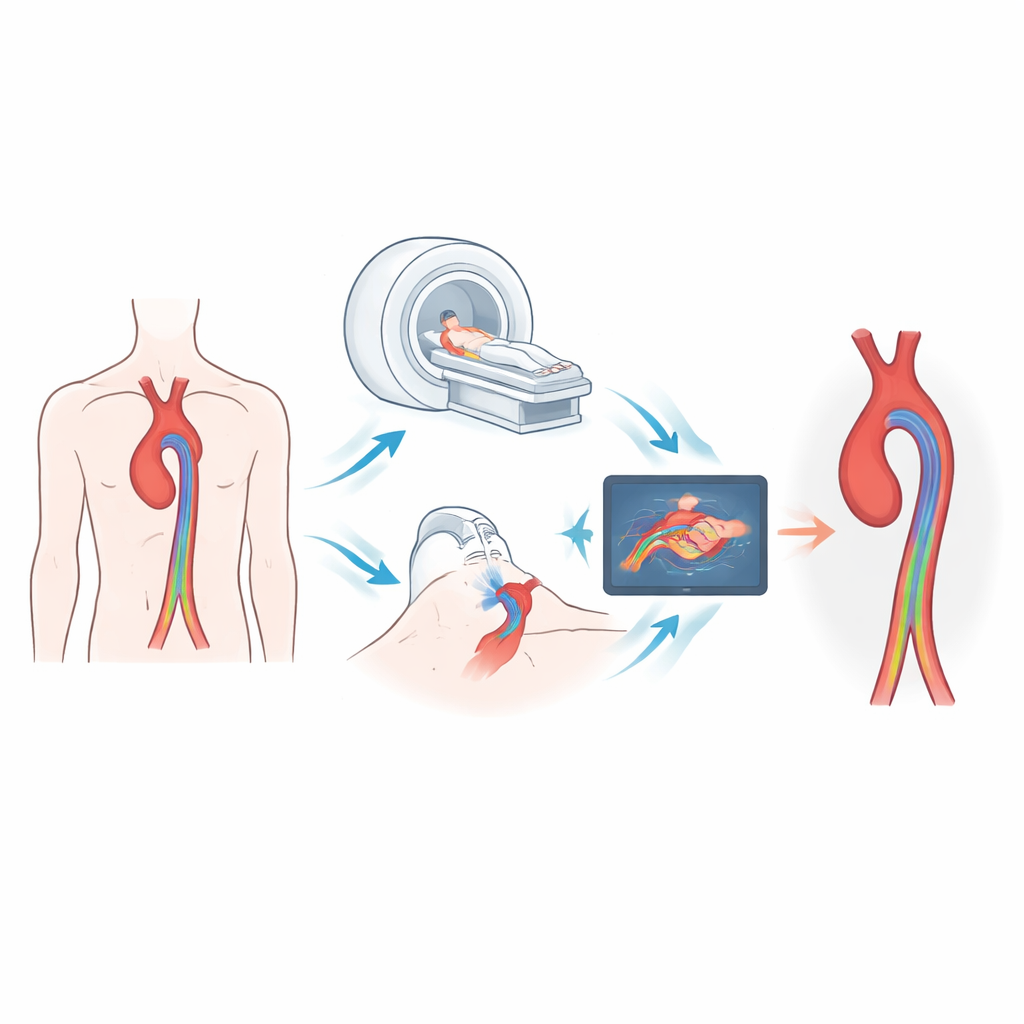
Looking for a Safer Way to Measure Heart Strain
Traditionally, doctors measure how much pressure is lost across the narrowed segment by using cardiac catheterization, an invasive procedure that exposes patients to X-rays and carries small but real risks. Noninvasive tools such as ultrasound and CT scans can show the shape of the narrowed aorta and estimate blood flow, but they often struggle to tell exactly how severe the blockage is, especially in older children and adults. The authors set out to build a method that combines these familiar scans with physics-based computer simulations to calculate the pressure change more precisely, without putting a tube into the artery.
Turning Images and Cuff Readings into a Digital Blood Flow Test
The research team studied 18 patients aged 6 to 49 years with severe narrowing of the aorta who were already scheduled for treatment with balloons or stents. For each person, they used CT images to rebuild a three-dimensional model of the aorta, including its branches. Ultrasound measurements of blood speed and simple arm and leg blood pressure readings from a cuff were then fed into a computer program that simulates how blood flows through this personalized artery model. In engineering terms, they used a computational fluid dynamics approach, coupled to a simplified “circuit” model that represents how the rest of the circulation loads the aorta. The result was a noninvasive estimate of how much pressure dropped across the narrowed segment before and after the procedure.
Putting the Virtual Measurements to the Test
Because all patients also underwent catheterization as part of their care, the authors could directly compare three numbers: the invasive pressure measurement, the usual ultrasound estimate, and their new computer-based estimate. Before treatment, the average pressure drop across the narrowing was about 56 mmHg by catheter, 58 mmHg by the computer model, and 58 mmHg by ultrasound. After treatment, the catheter showed a drop of about 16 mmHg, the model 18 mmHg, and ultrasound 21 mmHg. Statistically, the computer-based values tracked the catheter readings very closely both before and after repair, whereas the ultrasound estimates were more scattered and tended to misjudge the true pressure difference, especially after intervention. The digital models also revealed how flow patterns, pressure on the vessel wall, and rubbing forces on the inner lining changed once the narrowing was opened.
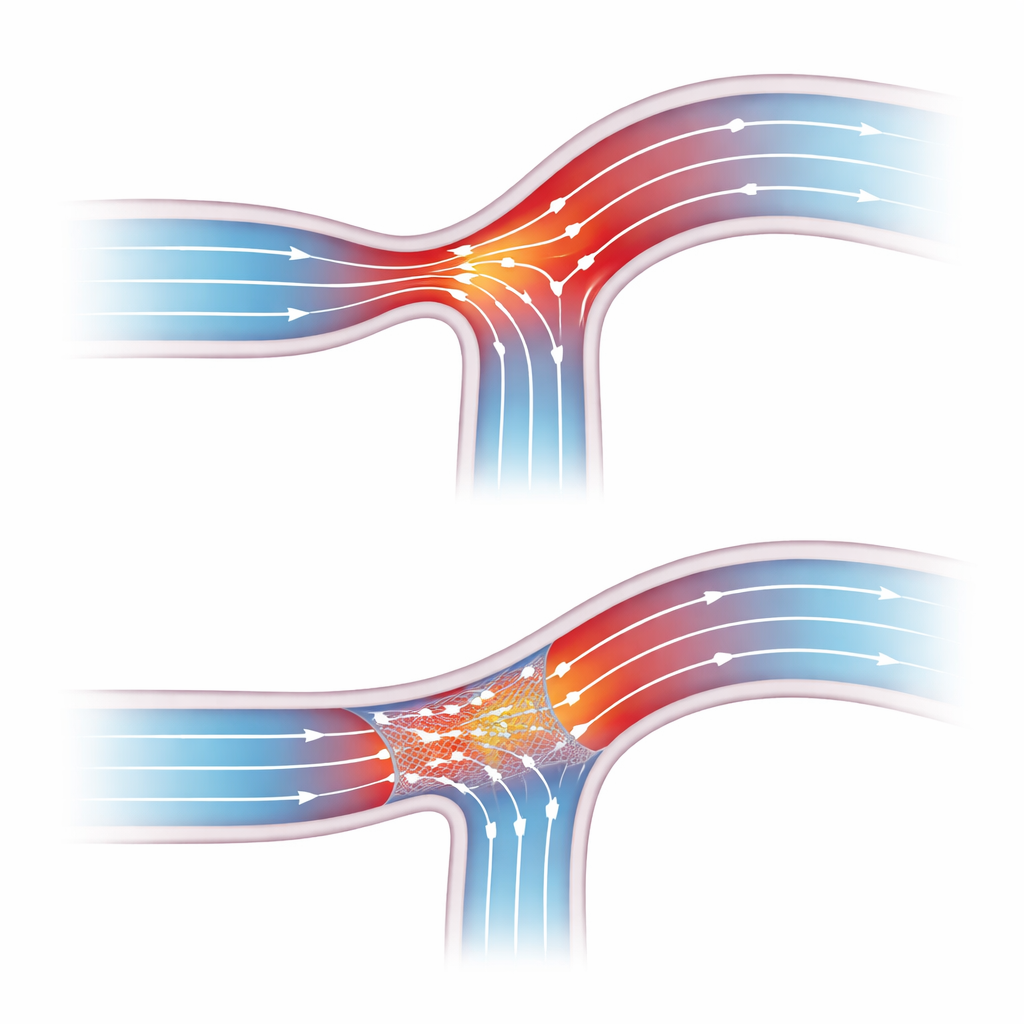
What Happens to Blood Flow After Repair
In the computer simulations, severely narrowed aortas showed very fast, swirling blood flow at the pinch point, with high pressure building up just before the narrowing and unusually strong frictional forces on the vessel wall. These patterns are thought to contribute to long-term damage of the artery and to extra strain on the heart. After balloon or stent treatment, the virtual flow became smoother and more evenly spread out, and the high-pressure region shrank. Overall wall stresses and local pressure extremes dropped, mirroring the improvements seen in the patients’ arm–ankle blood pressure differences and kidney function tests following the procedure.
What This Could Mean for Patients
This study suggests that a carefully built computer model, based only on standard CT scans, ultrasound readings, and arm and leg blood pressures, can closely match the invasive gold-standard measurement of how severe aortic coarctation is. While it does not yet replace catheterization in every case, it points toward a future in which many patients could be monitored and planned for treatment using noninvasive “virtual catheterization.” That could reduce risk, limit radiation exposure, and give doctors a rich, three-dimensional view of how blood is behaving inside each patient’s aorta, helping to time and tailor interventions more safely.
Citation: Hu, M., Li, X., Wang, H. et al. Noninvasive hemodynamic assessment of aortic coarctation: multimodal imaging based-computational fluid dynamics. Sci Rep 16, 12677 (2026). https://doi.org/10.1038/s41598-026-42761-z
Keywords: aortic coarctation, noninvasive imaging, computational fluid dynamics, heart blood flow, cardiac catheterization