Clear Sky Science · en
Comparing effective and functional connectivity
Why Brain Wiring Maps Matter
Our thoughts, memories, and actions arise from billions of brain cells talking to each other. Modern technologies now let scientists eavesdrop on these conversations at large scale, but they do so in very different ways. This study asks a deceptively simple question with big implications: when we see groups of brain cells lighting up together, does that really tell us how they are wired together? By directly comparing two popular ways of mapping brain connections, the authors show that each method reveals a different side of how the brain works—and that mixing them is key to understanding brain computation.
Two Ways to Listen to the Brain
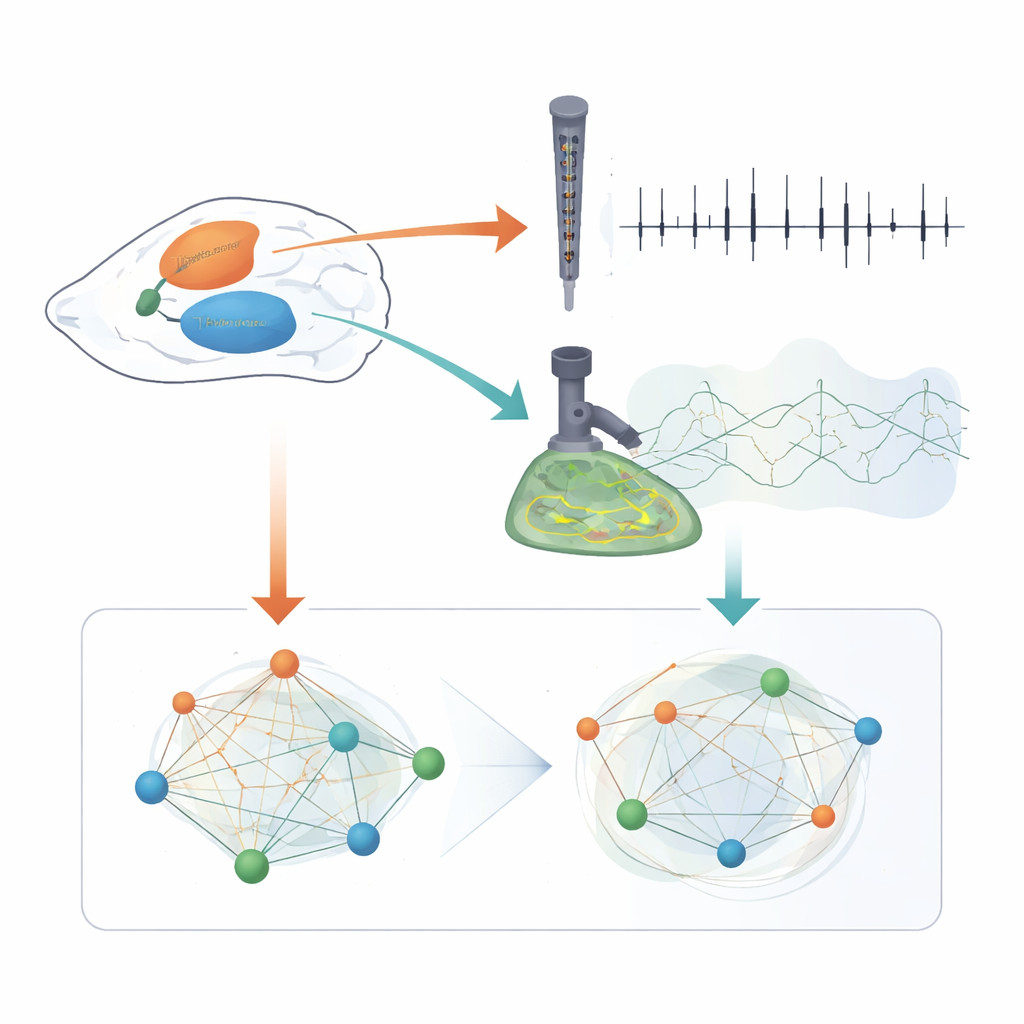
Neuroscientists often talk about two kinds of connections. One is the physical “wiring” between nerve cells: tiny junctions called synapses where one cell can directly influence another within a few thousandths of a second. In this paper, these direct links are called effective connectivity, because they capture who actually affects whom in the circuit. The other kind is functional connectivity, which is not about physical links but about which cells tend to be active together over time. Functional connectivity is usually measured with optical methods that track slow changes in calcium inside cells, a stand-in for their electrical activity. The authors set out to see how these two views line up when they are measured from the very same neurons.
Reading the Brain’s Fine-Scale Wiring
To probe the brain’s wiring, the researchers used high-density electrode probes, known as Neuropixels, to record the precise spike times of 242 neurons across three mouse brain regions: thalamus, hippocampus, and visual cortex. They then applied an advanced statistical method, ShinGLMCC, to infer which neurons were likely to be directly connected. This analysis correctly recovered many known features of brain anatomy. For example, it found strong one-way pathways within the hippocampus and visual cortex that match established circuit diagrams, and it cleanly separated neurons that mainly excite others from those that mainly inhibit. Inhibitory neurons formed rich reciprocal loops with excitatory neighbors, consistent with “winner-takes-all” competition where some activity patterns suppress others. Repeating the analysis on different halves of the data produced nearly identical wiring diagrams, suggesting the estimates were stable and reliable.
Following Slow Waves of Activity
Next, the authors turned the same spike recordings into artificial calcium signals, mimicking what a two-photon microscope would see. Each spike was converted into a smooth pulse that rose quickly and faded over tens to thousands of milliseconds. By correlating these slow signals between pairs of neurons, they built maps of functional connectivity at different timescales. Strong positive correlations tended to link neurons within the same brain region, while negative correlations were more spread out. Shortening the assumed calcium timescale made these functional networks more localized and, at first glance, a bit closer to the underlying wiring. However, even at unrealistically fast timescales, most strongly co-active pairs were not directly connected, and the best statistical match between the two maps remained far from perfect.
When Shared Inputs Muddy the Picture
To understand why co-activity diverges from wiring, the team built a computer model of an artificial network whose connections were copied from their inferred wiring diagram. They tuned the model so that the simulated neurons fired at the same rates as the real ones, then examined both effective and functional connectivity in this closed system. In the isolated network, functional connectivity reflected the true wiring somewhat better than in the real data. But when they gently boosted the input to a subset of neurons—mimicking a weak sensory stimulus—those neurons suddenly appeared strongly functionally connected to one another, even though the actual wiring had barely changed. In other words, shared or fluctuating inputs could easily create the illusion of strong links where none exist, strongly shaping functional connectivity while leaving effective connectivity essentially untouched.
What This Means for Understanding the Brain
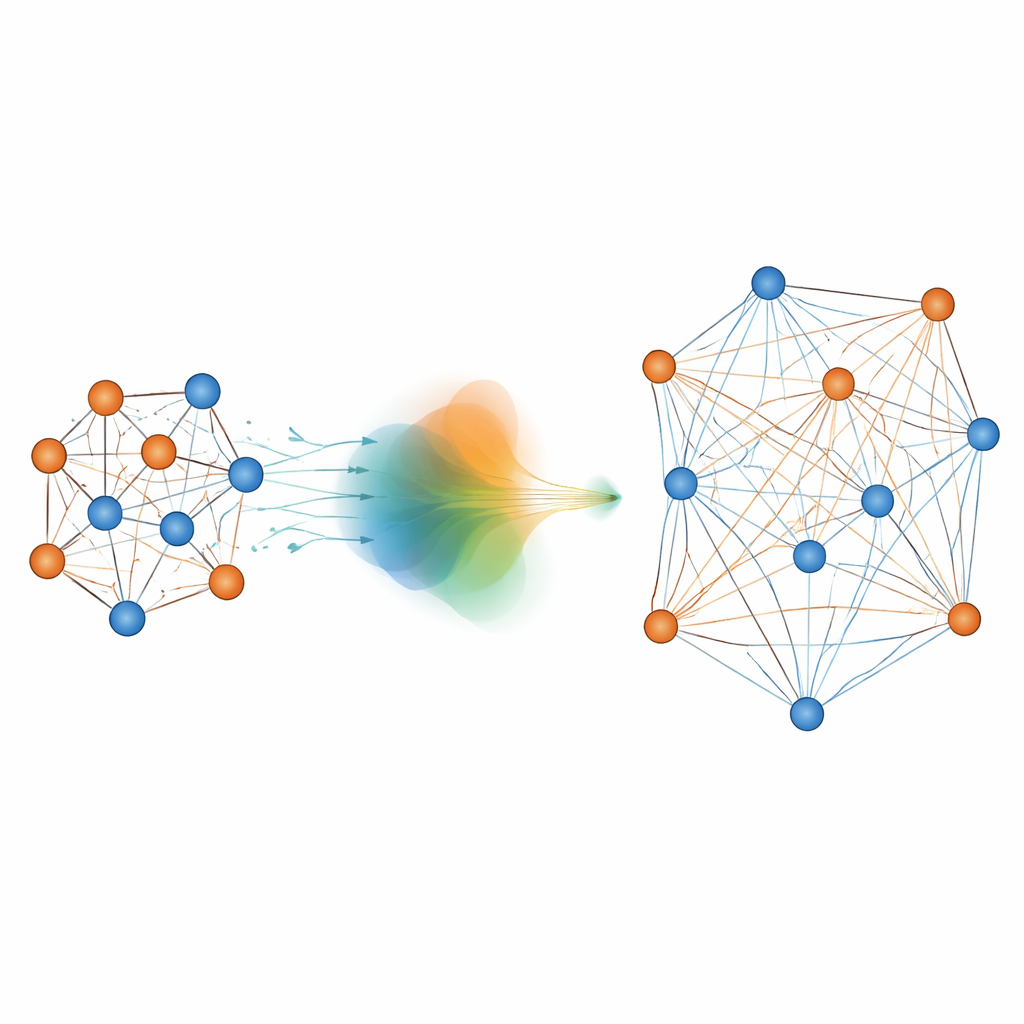
The study’s central message is that maps of co-activity and maps of physical influence are not interchangeable. Effective connectivity, drawn from fast electrical recordings, captures the brain’s hardware: who can directly nudge whom and on what rapid timescale. Functional connectivity, drawn from slower calcium signals, reflects the brain’s software: broader patterns of coordinated activity shaped by shared inputs, indirect pathways, and overall brain state. Even with faster imaging or more refined statistics, simple synchrony is unlikely to fully reveal the fine wiring beneath. To truly understand how brain circuits compute, the authors argue, future work must combine both views—using detailed wiring maps to anchor models of network dynamics, and using wide-field activity patterns to see how those circuits behave in real, ever-changing conditions.
Citation: Shinomoto, S., Tsubo, Y. Comparing effective and functional connectivity. Sci Rep 16, 12161 (2026). https://doi.org/10.1038/s41598-026-42580-2
Keywords: brain connectivity, neural circuits, calcium imaging, spike trains, network dynamics