Clear Sky Science · en
Spatiotemporal prediction of chlorophyll-a in semi-enclosed gulfs using a hybrid graph neural network-transformer framework with satellite data and causal analysis
Why watching tiny green cells matters
Along many dry coastlines, seawater desalination plants turn the ocean into drinking water. These facilities can be crippled when sudden bursts of microscopic algae clog filters and release toxins. This study explores a new way to forecast those algal surges in semi-enclosed seas such as the Persian Gulf by blending satellite observations with an advanced form of artificial intelligence. The goal is simple but powerful: give coastal managers and plant operators an early warning system before blooms turn into costly crises.
Seeing the sea from space
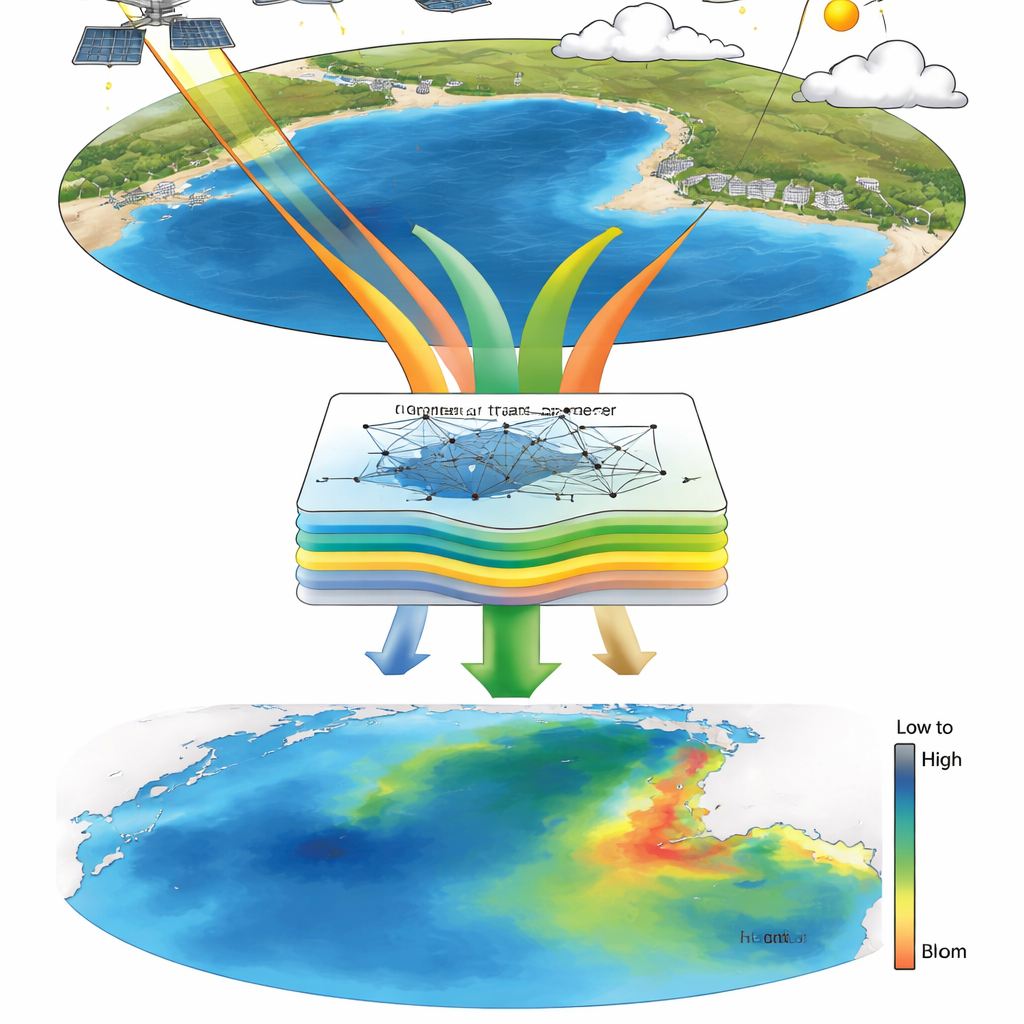
The research focuses on chlorophyll-a, a green pigment in microscopic plants that acts as a convenient “thermometer” of algal abundance. Instead of relying on scattered field measurements, the team pulls together more than 300,000 data points from satellites and global weather reanalyses. Instruments like NASA’s MODIS/Aqua provide monthly maps of ocean color, from which chlorophyll and related quantities—such as fluorescence and particles of organic carbon—are inferred. At the same time, large-scale climate products (ERA5 and HYCOM) contribute sea surface temperature, winds, waves, currents, clouds, and rainfall. All of these variables are rescaled and brought onto a common fine grid over the Persian Gulf, turning the surface of the sea into a dense, consistent data tapestry.
Teaching a smart map to follow patterns in space and time
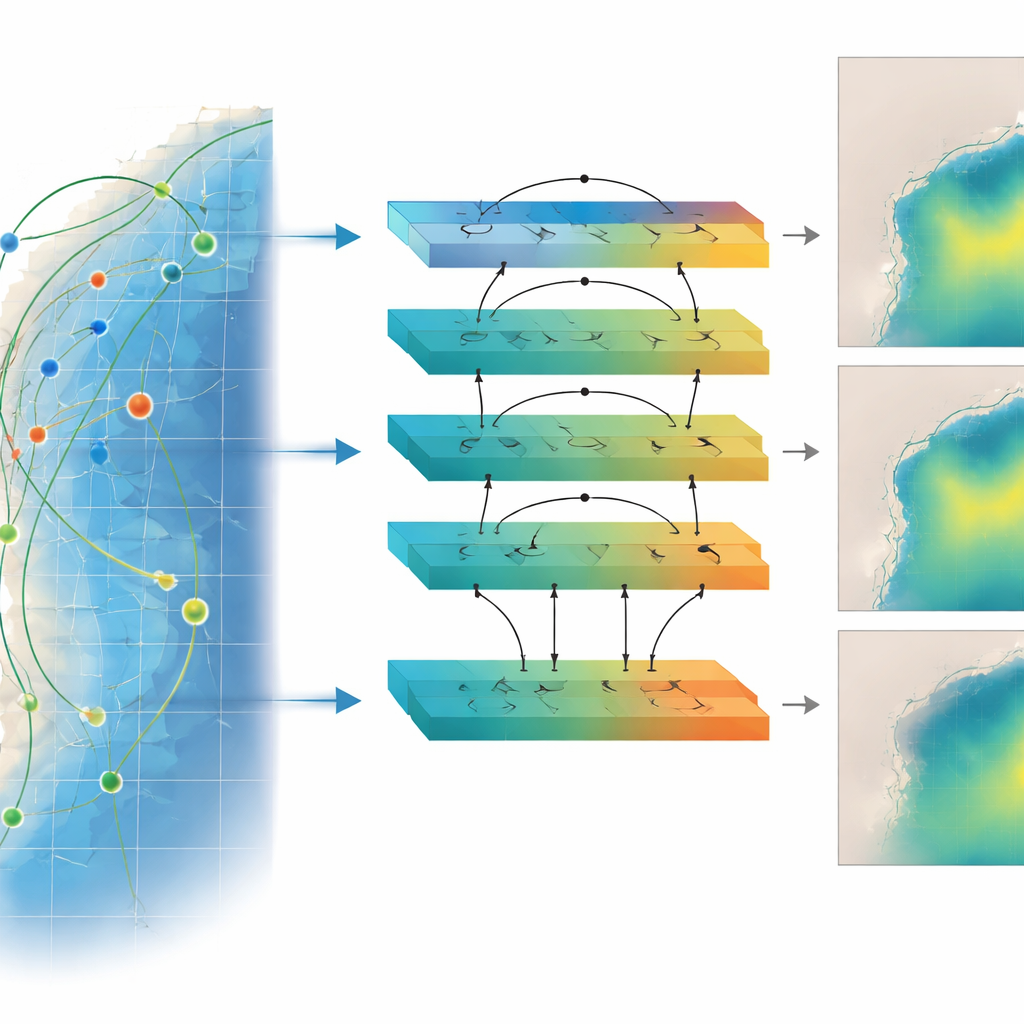
Traditional forecasting tools often treat the ocean as a set of evenly spaced boxes, which misses the real, irregular ways water connects through currents and coastlines. The authors instead build a “graph” of the gulf, where each location on the 4‑kilometer grid is a node and nearby points are linked according to distance and, in some cases, flow. A graph neural network passes information along these links, learning how local neighborhoods in the sea influence one another. On top of this, a transformer module—originally designed for language translation—looks along time sequences to capture long-range seasonal and year-to-year swings. Feeding one year of monthly data into this hybrid graph–transformer model, the system learns to predict chlorophyll-a levels for the following month across the gulf.
Finding what truly drives blooms
Not all variables matter equally, and simply checking which ones correlate with chlorophyll can be misleading. To dig deeper, the team uses a technique called convergent cross-mapping, which tests whether changes in one factor can help reconstruct changes in another, revealing hints of cause-and-effect rather than mere coincidence. This analysis—combined with a global sensitivity test that measures how much each input contributes to the model’s uncertainty—points to sea surface temperature, normalized fluorescence, and particulate organic carbon as especially influential. Using this causal lens, the authors pare the input list down to 13 key variables. Even with this leaner set, the model retains high skill while cutting computing costs by about one quarter, an attractive feature for routine operations.
How well the forecasts work, and how sure we can be
When pitted against a well-established deep learning rival (a combined convolutional and recurrent network), the hybrid graph–transformer clearly comes out ahead. In the Persian Gulf, it reproduces both the seasonal rise in chlorophyll during winter mixing and early spring, and the quieter summer period when warm, layered waters limit nutrients from below. It also highlights known hotspots, such as areas near the Strait of Hormuz and parts of the southern coast. A key test of any model is its performance elsewhere: when applied to the Gulf of Mexico without retraining from scratch, the approach still explains more than 90 percent of the variation in observed chlorophyll, hinting at global usefulness. To avoid overconfidence, the authors retain dropout layers during prediction and run the model many times, using the spread of outcomes to draw 95 percent confidence bands and maps of uncertainty.
Turning numbers into practical risk levels
For managers, the question is not only “How much chlorophyll will there be?” but also “How risky is it?” The study tackles this by translating predicted chlorophyll distributions into three percentile-based categories: typical bloom, intense bloom, and extreme bloom, corresponding to the 50th, 75th, and 90th percentiles of observed conditions. By combining these categories with uncertainty estimates, the authors generate probability maps that show where serious blooms are likely, where they are possible, and where conditions are usually safe. Such maps can be overlaid with the locations of desalination plants and aquaculture sites, guiding early warnings, maintenance schedules, and emergency responses.
What this means for coasts and clean water
The work demonstrates that marrying graph-based learning with transformer-style attention can turn raw satellite streams into reliable, probabilistic forecasts of algal conditions in complex coastal seas. While the method still depends on satellite products that can be imperfect in murky waters, and would benefit from more direct field checks, it already offers a practical tool for anticipating harmful blooms days to months ahead. For regions that rely heavily on desalination, such as around the Persian Gulf, this kind of intelligent monitoring could help keep drinking water flowing, protect marine life, and reduce economic losses as climate and human pressures intensify.
Citation: Zarbipour, P., Akbari, H., Nikoo, M.R. et al. Spatiotemporal prediction of chlorophyll-a in semi-enclosed gulfs using a hybrid graph neural network-transformer framework with satellite data and causal analysis. Sci Rep 16, 13973 (2026). https://doi.org/10.1038/s41598-026-42388-0
Keywords: harmful algal blooms, chlorophyll-a forecasting, satellite oceanography, graph neural networks, desalination risk