Clear Sky Science · en
An integrated budget calculation model for environmental geological mapping
Why mapping costs matter to everyday life
Behind every safe bridge, stable hillside, and clean drinking-water source lies a quiet army of geologists mapping the ground beneath our feet. Their work helps cities avoid landslides, protect aquifers from pollution, and plan new roads and housing safely. But these large, complex mapping projects depend on public funding, and until now, governments have lacked a clear, up‑to‑date way to calculate what such surveys should realistically cost. This study builds a modern budgeting recipe for environmental geological mapping so that limited tax money can be spent more wisely while keeping communities safer.
How the authors tackled messy real-world data
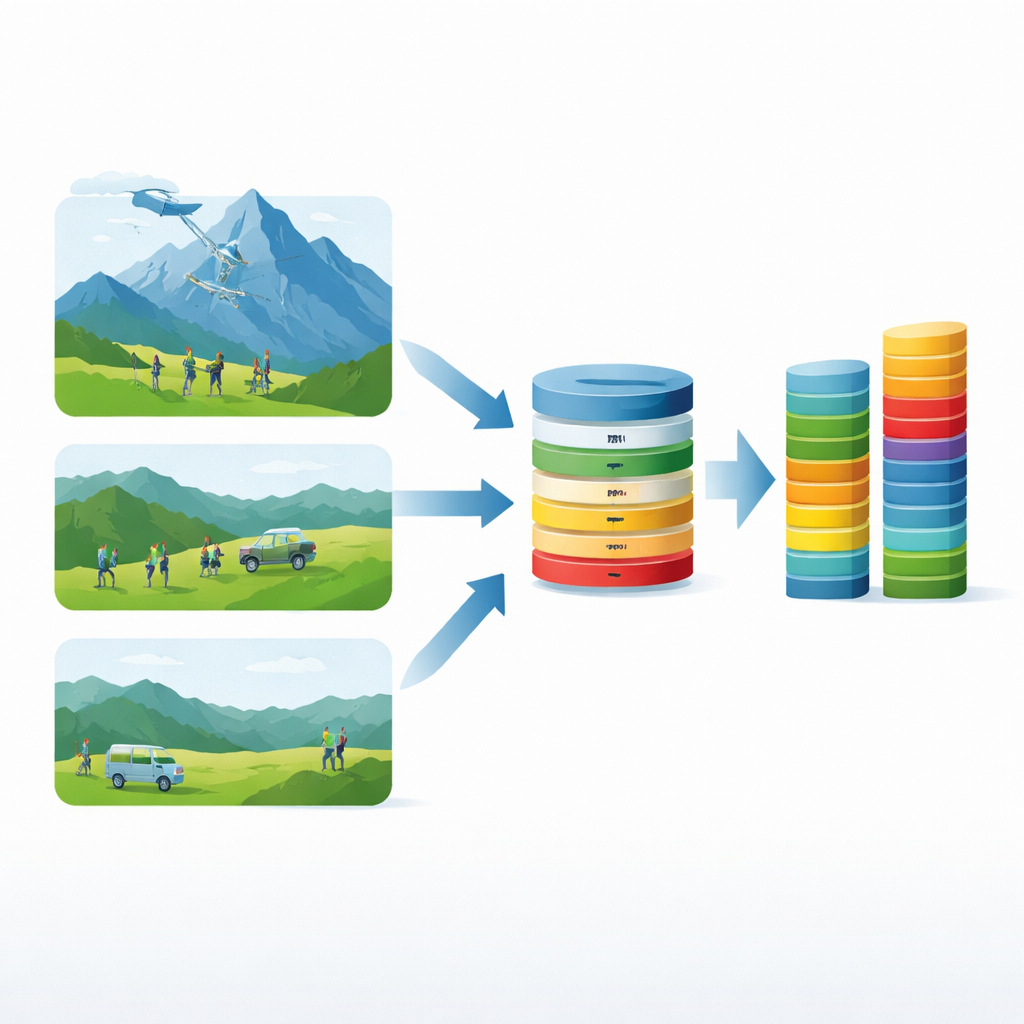
China has been running many environmental geological mapping projects at a standard scale of 1:50,000, but its official budget rules were last updated in 2009—before drones, portable sensors, and today’s higher wages became common. The authors set out to close this gap using real evidence from the field. They gathered 12,843 daily work logs from 16 mapping teams that had surveyed very different parts of the country, from flat plains to rugged mountains. These logs recorded who worked where, for how long, what equipment they used, how far they drove, and how much ground they covered. By cleaning and standardizing these records, the team could turn scattered notebooks into a consistent picture of how environmental mapping actually consumes time and money across China.
Turning fieldwork into a fair budget recipe
From this giant dataset, the researchers broke the work down into everyday building blocks: labor, equipment, materials, and transportation. For each block, they asked three simple questions: how much work is done, what does each unit cost, and how do these combine into overall expenses? They calculated a typical “group-day efficiency” of 4.8 square kilometers of land mapped per field team per day, choosing this most common value instead of an average that could be distorted by unusual projects. They also defined standard team sizes and roles, annual use of items like sampling bags and batteries, and realistic driving distances for off-road vehicles. Together, these pieces form a transparent cost model that links what happens in the field directly to the money required to do it properly.
Accounting for rough ground and local prices
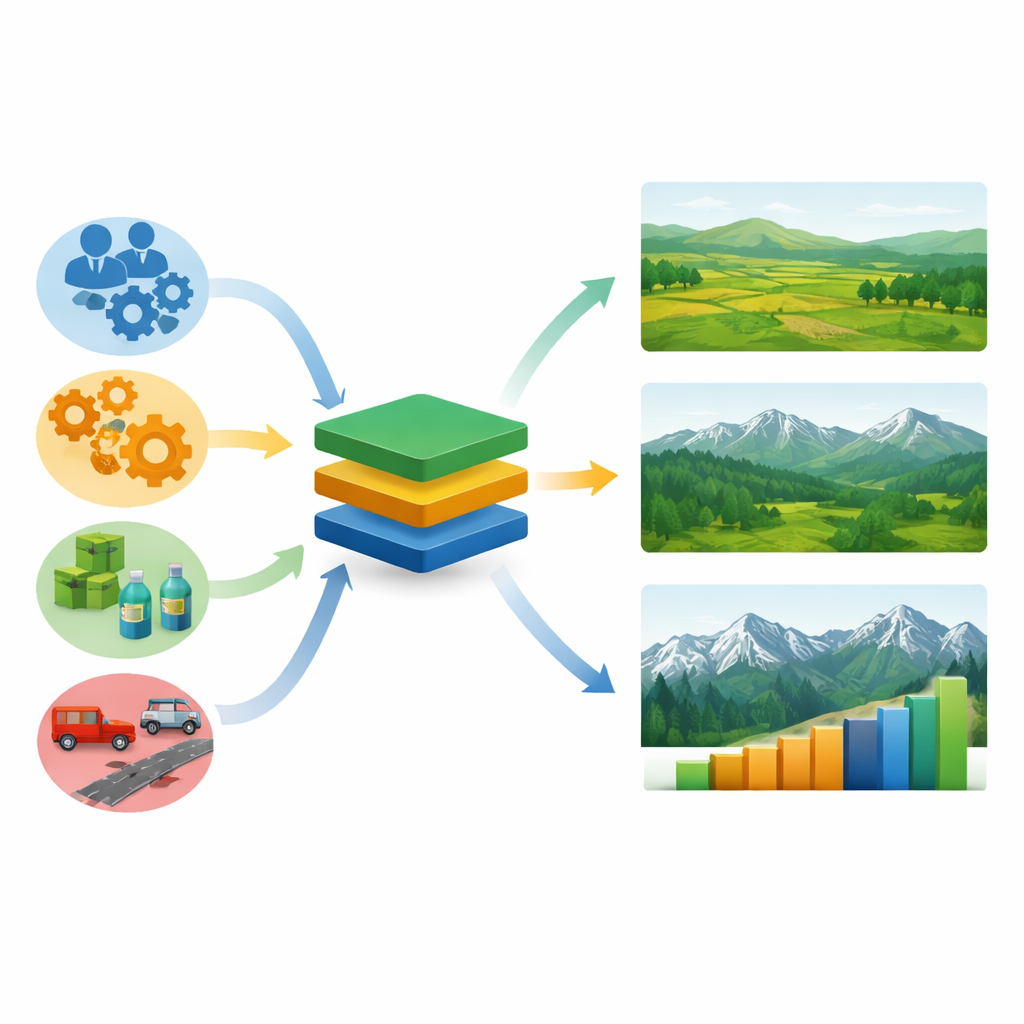
Of course, not all landscapes are equal. Mapping a flat, well-roaded plain is far easier than working in steep mountains with thick vegetation and frequent hazards. The study tackles this by introducing two sets of “knobs” that adjust the basic budget. One knob reflects how geologically simple, moderate, or complex an area is, based on expert scores for factors like rock structure, terrain, and exposure of bedrock. In simple areas, costs stay at the baseline level; in moderate and complex areas, they rise by about 20% and 50%, respectively. The second knob adjusts for regional price differences, such as higher wages, fuel costs, or shorter workable seasons in some provinces. Together, these adjustments mean that projects in tough or expensive regions can be funded fairly without overpaying where conditions are easier.
Testing whether the model matches reality
To see if their recipe worked, the authors compared the budgets produced by their model with the actual costs of three test projects in different geological settings. The differences were all under 3 percent—far better than earlier, more generic methods. This close match suggests that the model captures the main drivers of real-world spending, from staff time and vehicles to specialized instruments. It also helps guard against a common problem in public contracts: bids pushed so low that teams cut back on essential work like sampling and safety measures, putting both data quality and people at risk.
What this means for safer land use and public spending
For non-specialists, the main message is straightforward: using detailed, real data from past projects, this study builds a practical, adjustable formula for what it should cost to map the ground safely and thoroughly. Governments can now set survey budgets that better reflect modern tools, rising wages, and the extra effort needed in difficult terrain. That makes it easier to plan climate‑resilient cities, protect water resources, and manage geological hazards without wasting funds. As the same approach is expanded to other map scales and more regions, it could become a universal budgeting toolkit that quietly supports safer, smarter decisions about how and where we build.
Citation: Luo, G., Tao, M., Zhang, W. et al. An integrated budget calculation model for environmental geological mapping. Sci Rep 16, 11877 (2026). https://doi.org/10.1038/s41598-026-42327-z
Keywords: environmental geological mapping, budget standards, geological surveys, cost modeling, public infrastructure planning