Clear Sky Science · en
Multidimensional evaluation of four high-resolution precipitation products based on REOF zones in the upper and middle Hanjiang River Basin
Why rainfall maps matter for rivers and cities
Rain may seem simple, but where and when it falls can make the difference between safe reservoirs and damaging floods. Engineers and planners now rely heavily on digital rainfall maps built from satellites, weather stations and models to design dams, manage water transfers and warn of droughts. This study asks a practical question for one of China’s key water supply rivers: which modern rainfall maps are most trustworthy, and does their performance change from place to place inside the same basin?
Breaking the river into natural rain neighborhoods
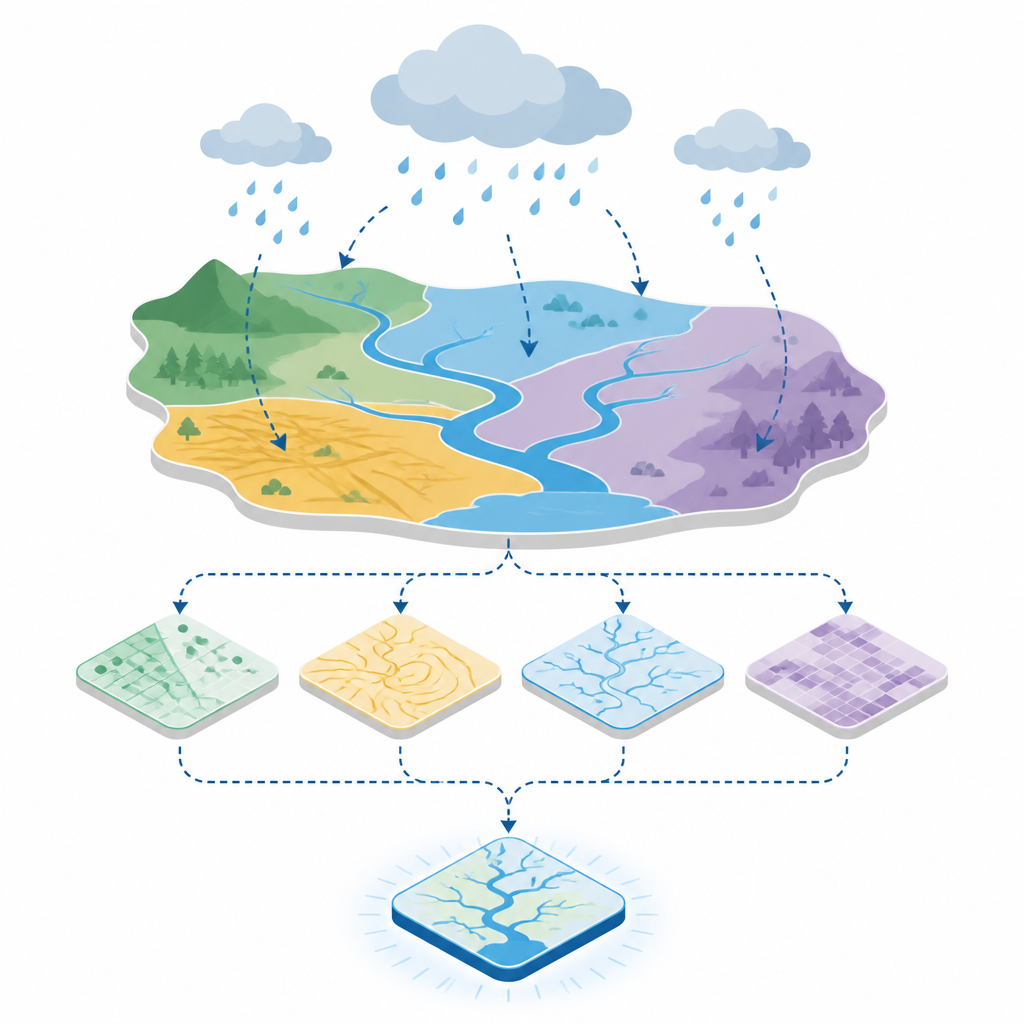
The researchers focus on the upper and middle Hanjiang River Basin, an important source for the South to North Water Transfer Project and flood control along the Yangtze. Rather than treating the basin as one uniform area, they use a statistical method to let the long record of observed rainfall “speak for itself.” This method groups parts of the basin that tend to see rain rise and fall together over the years, revealing five distinct rainfall zones linked to mountains, lowlands and local climate. These zones act like natural rainfall neighborhoods within the larger basin, each with its own typical patterns.
Putting four popular rainfall maps to the test
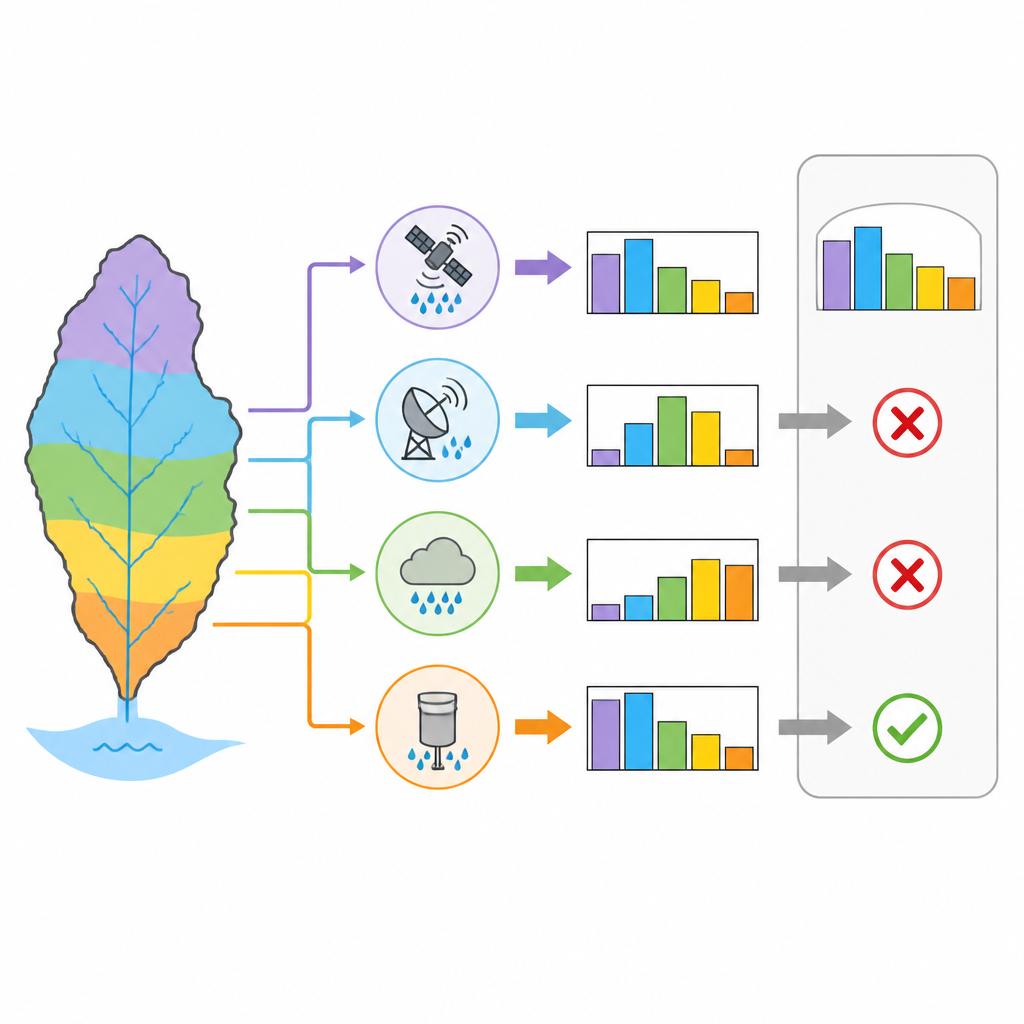
With these zones defined, the team tests four high resolution rainfall products that are widely used in China and around the world. Two come mainly from satellites, one is a blended meteorological forcing product for land studies, and one is a new gridded dataset built from thousands of Chinese rain gauges. Using daily data from 42 weather stations, they compare each product’s ability to match real station measurements, looking at how closely day to day variations line up, how large the typical errors are, and whether the products systematically add or miss water over time.
How performance changes across the basin
Across the full basin, all four products capture the broad pattern that rainfall increases from north to south and is concentrated in the warm season. But when the analysis zooms into the five rainfall zones, clear differences emerge. The gauge based Chinese dataset stands out, showing very tight agreement with station data in every zone, with small errors and little overall wet or dry bias. The land forcing dataset performs next best, generally underestimating amounts but tracking changes reasonably well. The two satellite based products show more mixed results: one tends to overestimate or underestimate in different subregions, while the other often matches the spread of intensities but has larger biases and weaker performance in some zones.
Rain event frequencies and extremes
The study also asks whether the products get the character of daily rain right, not just the totals. For light showers, steady rain and heavy downpours, they examine how often each intensity occurs in observations versus in the products. One satellite based product does the best job of reproducing the overall shape of these frequency curves, especially for a range of rain strengths, suggesting it is useful for studies that care about how often different kinds of rain happen. In contrast, the new Chinese gauge based dataset tends to classify too many days as essentially dry, even though it otherwise matches daily amounts very closely. When it comes to extreme events such as the wettest day of the year or the wettest five day spell, the gauge based dataset again performs best overall, but the satellite products show serious drops in skill in specific zones, even when they look acceptable for the basin as a whole.
What this means for water management and research
For decision makers, the message is twofold. First, among the four tested products, the new Chinese gauge based rainfall dataset is generally the most reliable choice for the Hanjiang Basin, especially where accurate daily totals and extremes matter for flood and drought work. Second, and just as important, a rainfall product that looks good when averaged over an entire basin may hide weak spots in certain subregions, particularly for extreme downpours. By carving the basin into natural rainfall zones and testing performance in each, this study shows that users should match their data choice to both the type of analysis and the specific part of the basin they care about, rather than relying only on whole basin statistics.
Citation: Bo, H., Huang, X., Yang, S. et al. Multidimensional evaluation of four high-resolution precipitation products based on REOF zones in the upper and middle Hanjiang River Basin. Sci Rep 16, 15441 (2026). https://doi.org/10.1038/s41598-026-42304-6
Keywords: precipitation products, rainfall zoning, Hanjiang River Basin, satellite rainfall, extreme precipitation