Clear Sky Science · en
Multi-temporal analysis of mountainous terrain changes based on UAV images and point cloud data
Watching Mountains Breathe and Shift
Steep mountain landscapes may look timeless, but they are among the most restless places on Earth. Heavy rain, earthquakes, landslides, and slow ground creep can quietly reshape valleys, damage homes, and cut off roads. This study shows how small drones and advanced image analysis can turn these rugged regions into carefully monitored spaces, revealing where the ground has moved by just a few centimeters up to several meters. That information can help guide rescue teams after disasters and support safer planning for communities living on unstable slopes.
Why Mountain Changes Are Hard to See
Measuring how mountain terrain changes over time is far from straightforward. Steep cliffs cast deep shadows, thick vegetation hides the ground, and parts of the landscape are often blocked from view. Traditional aerial photographs or satellite images can miss subtle movements, and even high-tech laser scans can be thrown off when tree branches sway or when terrain is only partly captured. The result is that dangerous shifts can go unnoticed, or false alarms can arise where only shadows or seasonal greenery have changed. Mountain regions thus need methods that see not only the surface colors from above but also the three-dimensional shape of the land beneath.
Using Drones to Capture the Shape of the Land
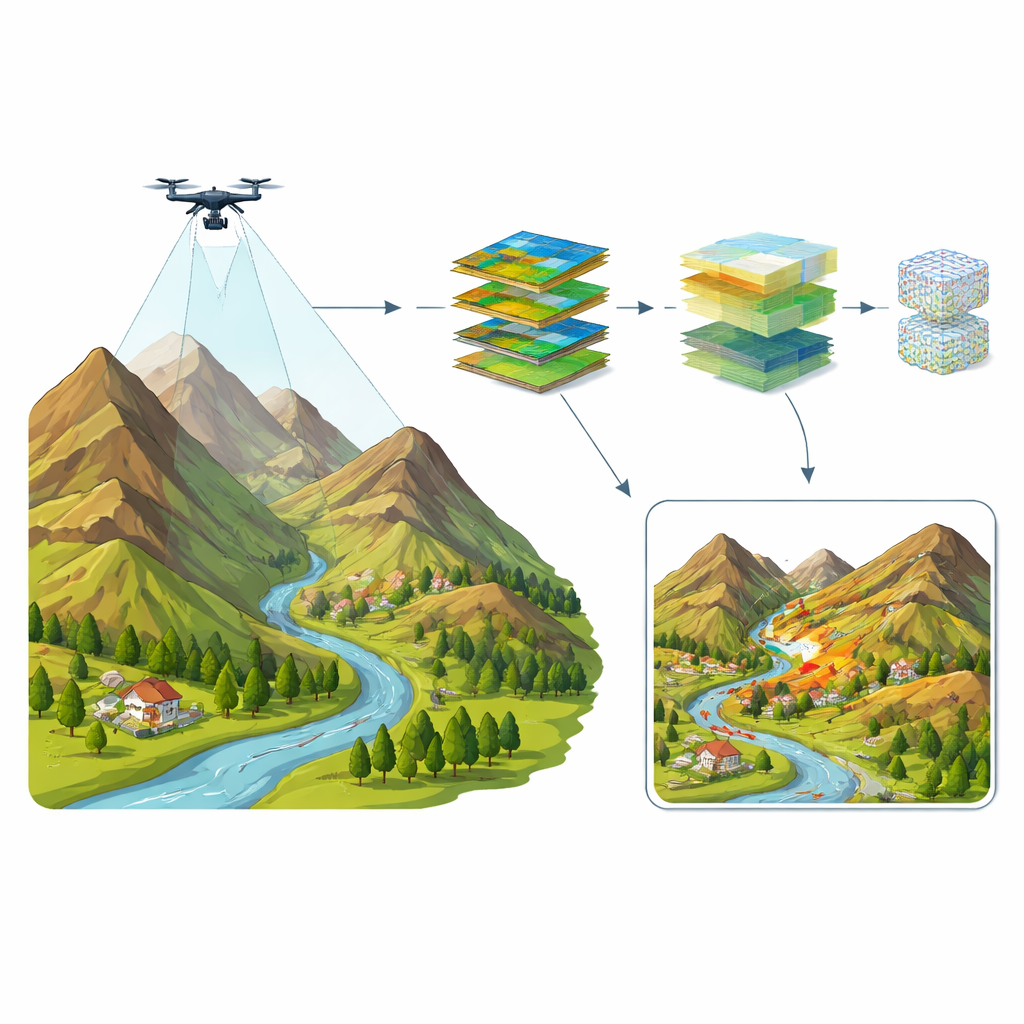
To tackle this challenge, the researchers flew unmanned aerial vehicles—small camera-carrying drones—over a six-hectare area in Taiwan’s Guanziling mountains twice, about one year apart. By carefully planning overlapping flight paths and keeping the flying height low, they collected thousands of high-resolution images, where each pixel represents just two centimeters on the ground. From these photographs, open-source software was used to reconstruct detailed three-dimensional “point clouds,” in which millions of colored points map the surfaces of buildings, trees, roads, and bare ground. This digital landscape was anchored to real-world coordinates with ground control markers, ensuring that the two surveys could be compared with centimeter-level precision.
Teaching the Computer to Understand the Scene
High detail alone is not enough—the computer also needs to know what it is looking at. The team trained a deep learning model called DeepLabv3 to perform semantic segmentation, which means assigning every pixel in the drone images to a simple category such as building, road, vegetation, river, or other human-made objects. They manually labeled hundreds of image tiles from the first survey to create a ground-truth map and then used this to teach the network to recognize similar patterns. The trained model proved highly accurate, correctly matching the human labels for most categories more than 90 percent of the time over complex, hilly terrain. This step allowed the system to separate rigid features, like houses and roads, from more changeable ones like foliage, which is crucial when deciding whether an apparent change is worrisome or just the movement of leaves.
Measuring Real Ground Movement in 3D
Once the two surveys were aligned and every pixel was classified, the researchers turned to the point clouds to measure how much the land itself had moved. They used a method called Multiscale Model-to-Model Cloud Comparison, which looks along the local slope of the terrain and calculates how far the surface has shifted between the two time periods, while also estimating the uncertainty in each measurement. In stable places such as building roofs and paved roads, the method reported an average mismatch of only about four centimeters, confirming that the alignment was tight. In areas of major change, the system detected average displacements of about three meters, with most of the affected points clearly above the noise level—strong evidence of real ground movement rather than measurement error.
Seeing What 2D Pictures Miss
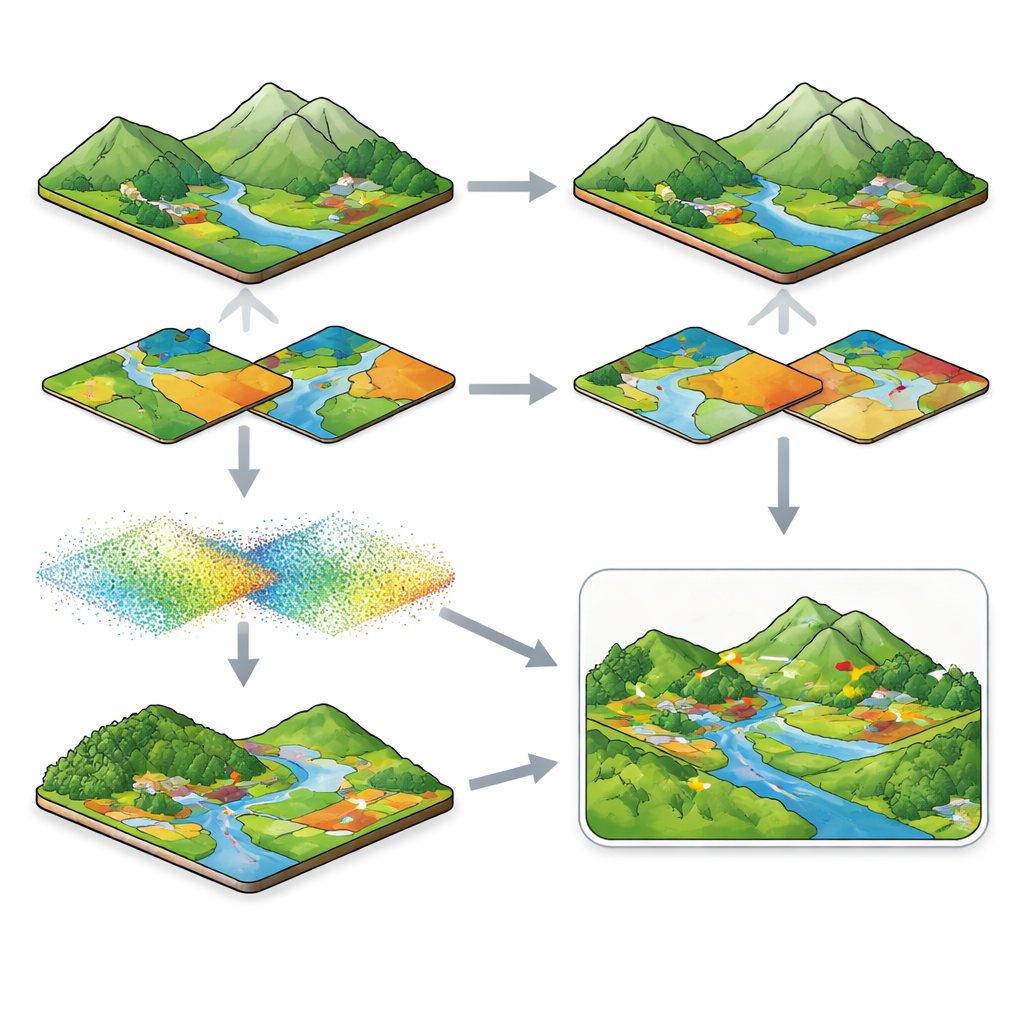
The true power of the framework lies in combining the two-dimensional and three-dimensional views. A simple comparison of classified images from the two dates sometimes flagged changes where none had truly occurred, for example in regions darkened by shifting shadows or covered by denser vegetation. By cross-checking those apparent changes against the 3D displacement map, the researchers could discard cases with little or no measured movement. In one set of “medium change” zones, a 2D-only approach detected less than a tenth of the actual shifts, while the 3D analysis uncovered real displacements averaging more than two meters, even where trees partly hid the ground. This 2D–3D fusion turned a noisy patchwork of apparent changes into a clearer picture of where the land had actually deformed.
What This Means for Mountain Communities
In everyday terms, the study demonstrates a practical recipe for watching unstable mountain terrain breathe and shift over time. By pairing inexpensive drone surveys with smart image labeling and precise 3D distance measurements, officials can map where slopes are creeping, where landslides have grown, and how close such changes are to homes and roads. The system’s strong agreement with human-made reference maps suggests that its change estimates are trustworthy enough to inform post-disaster assessments, landslide monitoring, and long-term planning. As this approach spreads, communities living in rugged regions could gain earlier warnings of ground movement, more accurate damage maps after storms or quakes, and better information for deciding where—and where not—to build in the future.
Citation: Hou, TC., Trinh, T.B.N., Yang, TY. et al. Multi-temporal analysis of mountainous terrain changes based on UAV images and point cloud data. Sci Rep 16, 12792 (2026). https://doi.org/10.1038/s41598-026-42202-x
Keywords: mountain landslides, drone mapping, 3D point clouds, terrain change detection, disaster monitoring