Clear Sky Science · en
Global climatology of submesoscale restratification using machine learning
Why tiny ocean whirlpools matter
The surface of the ocean may look calm from space, but just beneath it lies a restless layer shaped by countless small whirlpools only a few kilometers across. These features, called submesoscale eddies, help decide how deep the surface ocean mixes, how heat is stored, and how nutrients are carried toward the light-filled surface where marine life thrives. Yet until now, scientists have lacked a simple way to track these motions across the entire globe over many years. This study introduces a new way to read the fingerprints of these hidden eddies from routine ocean measurements, revealing a global picture of when and where they are most active.
Small swirls in a big ocean
Submesoscale eddies are small compared with major ocean currents, but they are energetic and fast. They stir and tilt lighter and heavier water against each other in the upper few hundred meters of the sea. When they do this, they can rebuild layers in the surface ocean that were previously mixed down by winter storms. This rebuilding, or restratification, makes the surface layer shallower again in spring, affecting how quickly the upper ocean warms and how nutrients are supplied to microscopic plants. Because these eddies are so small, they are hard to observe directly and only recently have begun to appear in the finest computer models. That makes it difficult to answer basic questions: How common are they worldwide, and how does their influence change with the seasons?
Teaching a computer to read ocean profiles
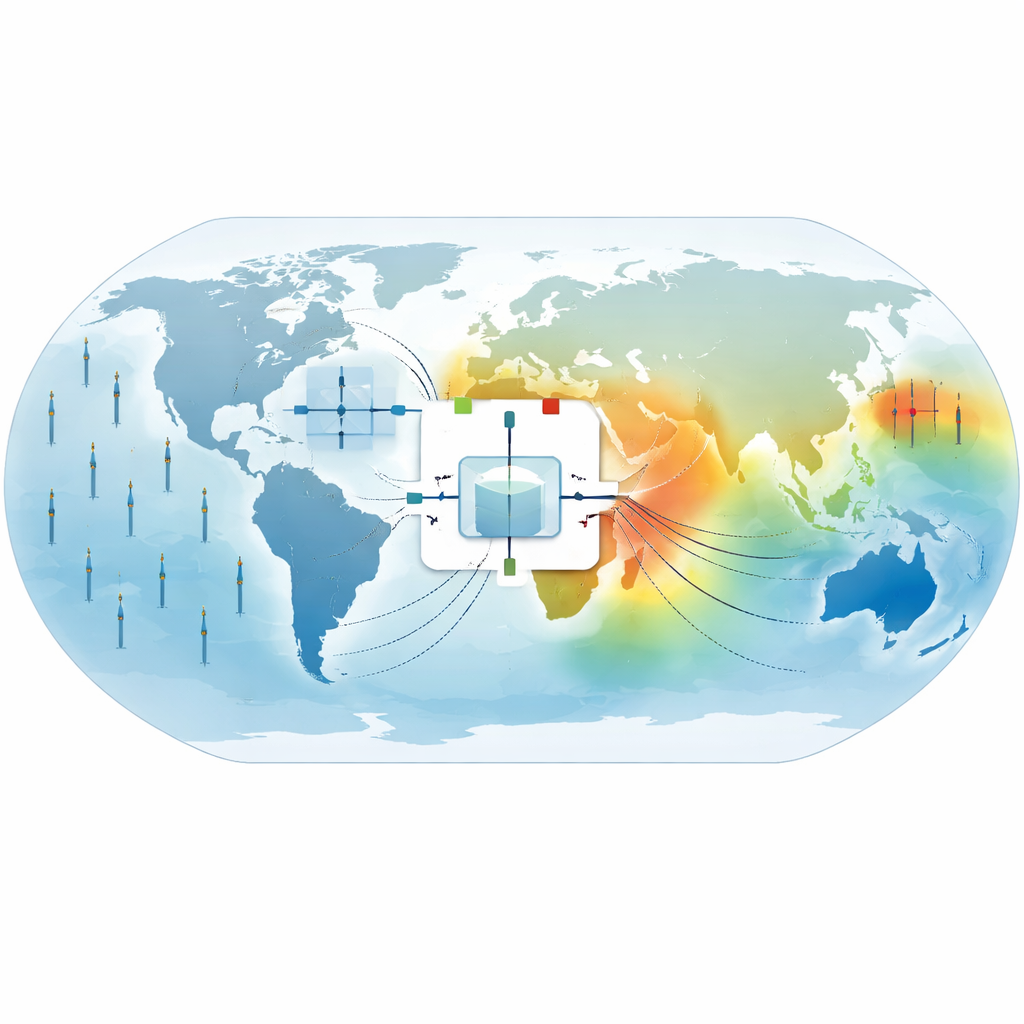
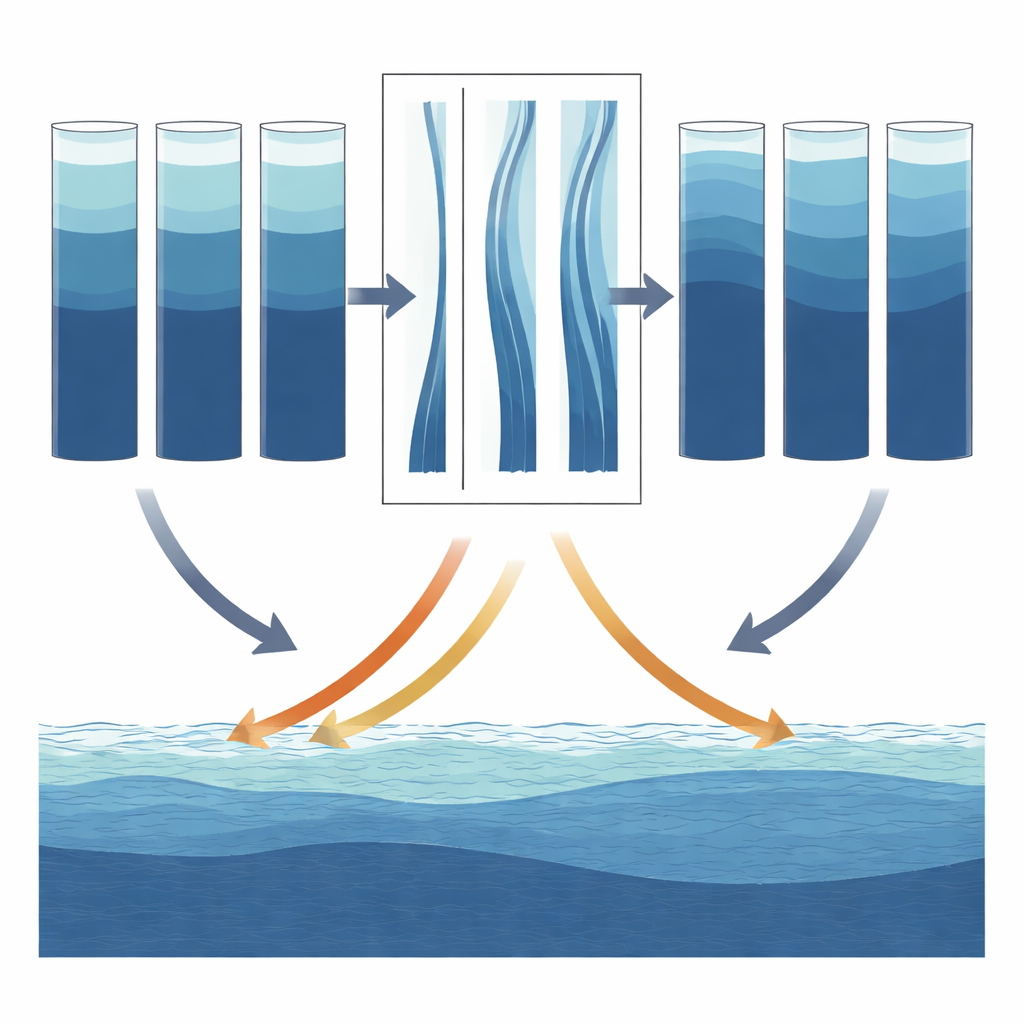
The authors turned to a vast but underused resource: more than 20 years of measurements from Argo floats, drifting robots that repeatedly dive from the surface to about two kilometers deep and record how heavy the water is at different depths. Instead of trying to see the eddies themselves, the team asked a different question: Can we detect their influence from the shape of the vertical density profile in the surface layer? They used an unsupervised machine learning method known as a profile classification model. First, for each float profile, they isolated just the part within the surface mixed layer and rescaled it so that all profiles could be compared on the same relative depth scale. They then let the algorithm group profiles purely by their shape, without telling it in advance what to look for.
Two distinct patterns in the surface ocean
The machine learning method consistently separated the profiles into two clear classes. In one class, density stayed almost constant from the surface down to the base of the mixed layer and then increased sharply below, the hallmark of a well-mixed surface layer. In the other, density increased gradually from the surface downward, indicating a weak layering even within the mixed layer itself. Previous high-resolution simulations had shown that this more gently layered shape appears when submesoscale eddies are actively restratifying the upper ocean. The authors therefore labeled these as “submesoscale active” profiles and defined a submesoscale restratification (SR) index: in any region and month, the SR index is simply the fraction of profiles that fall into this active class.
Seasonal rhythms and global hotspots
When the SR index is mapped over latitude and month, a striking seasonal pattern emerges. In both hemispheres, the index peaks in spring, a month or more after the surface mixed layer reaches its deepest point at the end of winter. The SR index is highest precisely when the mixed layer is shoaling most rapidly, supporting the idea that submesoscale eddies help drive the seasonal rebound of surface layering after storms. The global maps also reveal hotspots: strong signals along the Antarctic Circumpolar Current in the Southern Ocean, especially in the Drake Passage, and in the Norwegian Sea in the North Atlantic. Curiously, there is also a persistent band of high SR index near the equator, whose cause may involve heavy rainfall, river input, or energetic currents that distort the density structure in ways that resemble restratification.
Balancing mixing and rebuilding
To place their new index in a broader physical context, the authors compared it with a "restratification ratio" that measures the tug-of-war between surface forces that mix and erode layering (such as cooling, evaporation, and wind-driven overturning) and the restratifying action of submesoscale motions. Regions and seasons where mixing wins strongly tend to have a low SR index, while areas where restratification can compete effectively have a higher index. This link supports the idea that the profile-based index really is capturing when and where submesoscale eddies are reshaping the surface layer.
What this means for climate and future work
By turning millions of routine float measurements into a global map of submesoscale restratification, this study shows that the subtle fingerprints of tiny eddies are widespread, not confined to a few dramatic currents. More than half of nighttime springtime profiles worldwide bear the mark of active restratification. For a lay reader, the key message is that small, fast ocean swirls play a big role in how the surface ocean recovers from winter storms, which in turn influences climate predictions and marine ecosystems. The new index provides a practical tool for testing and improving climate models and for planning targeted field campaigns in regions where these hidden motions are likely to matter most.
Citation: Yao, L., Taylor, J.R. Global climatology of submesoscale restratification using machine learning. Sci Rep 16, 14309 (2026). https://doi.org/10.1038/s41598-026-41929-x
Keywords: ocean mixed layer, submesoscale eddies, Argo floats, machine learning in oceanography, ocean stratification