Clear Sky Science · en
A copula based supervised filter for feature selection in machine learning driven diabetes risk prediction
Why the most extreme cases matter
When doctors and health systems build tools to predict who is at risk for diabetes, they are often most worried about people at the extreme end of risk: those whose health and lifestyle factors signal trouble ahead. Yet many common machine‑learning methods quietly average over everyone, which can blur the picture for these highest‑risk patients. This paper introduces a new way to sift through large health datasets that deliberately focuses on those extremes, aiming to build prediction models that are both efficient and easier for clinicians to interpret.
Picking the right clues from a sea of data
Modern health surveys can track dozens of variables for hundreds of thousands of people, from age and weight to blood pressure, exercise habits, and mood. Not all of these measurements are equally helpful for predicting diabetes. The process of deciding which ones to keep is called feature selection. Traditional approaches rank each variable by its overall association with the disease, or by how much it improves a model’s accuracy. The authors argue that this misses an important nuance: a factor might matter most only in the highest‑risk group—say, very high body‑mass index or severely limited mobility—while looking modest on average. Their method is built to uncover precisely these “joint extremes,” where both a risk factor and the chance of having diabetes are simultaneously high.

A tail-focused way to rank risk factors
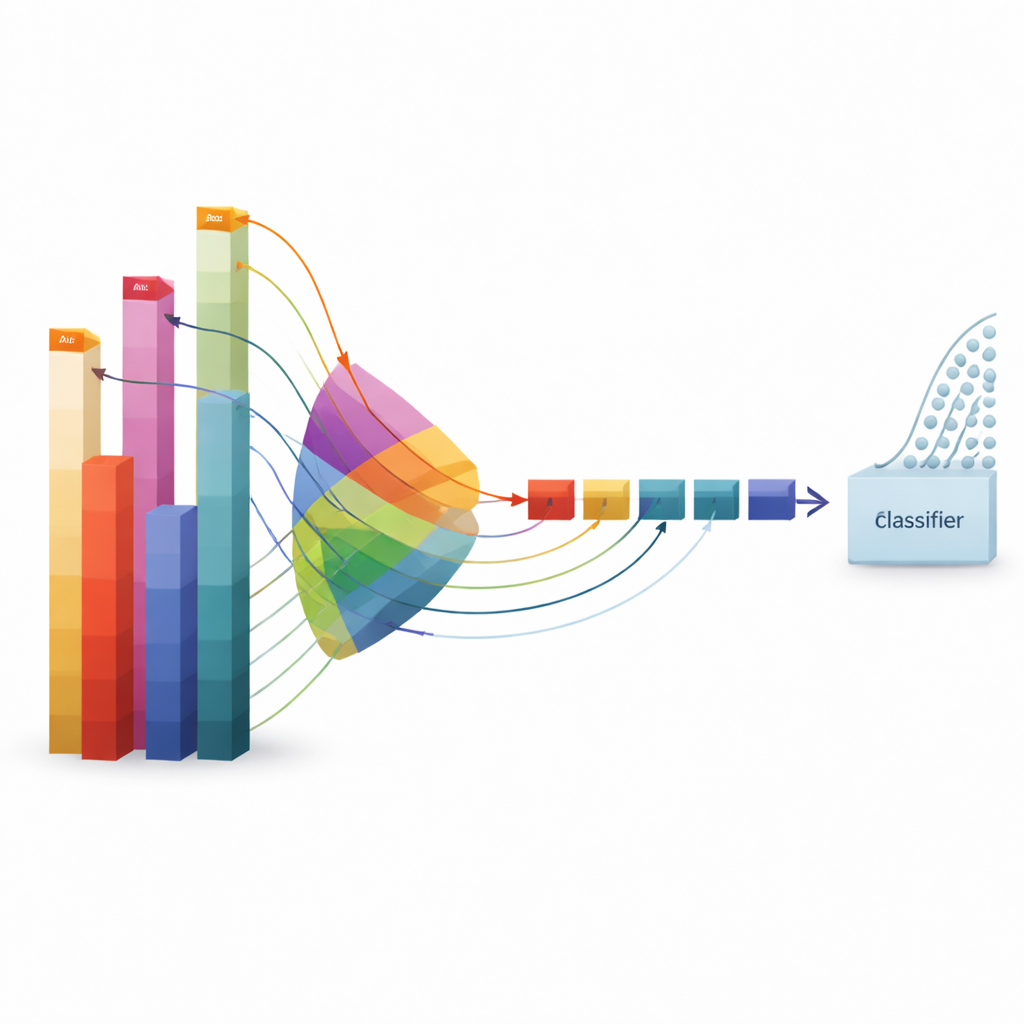
The study borrows a mathematical tool from the world of extreme‑value statistics known as a copula, and in particular a version called the Gumbel copula. Rather than modeling all details of the data, the authors use it as a scoring rule that tells them how often a given feature and diabetes status are extreme together in the upper tail of their values. They translate a standard rank‑based measure of association into a “tail concordance” score: if the score is high, that feature tends to be large specifically when a person has or is close to having diabetes. Each feature receives such a score, and the top‑scoring ones are kept for building prediction models. Because the method works on ranks instead of raw numbers, it is relatively insensitive to the exact units of measurement and can be computed quickly even on very large datasets.
Testing the idea on two very different datasets
To see whether this tail‑aware ranking is useful in practice, the authors apply it to two well‑known diabetes datasets. The first is a massive U.S. public health survey from the Centers for Disease Control and Prevention, covering more than a quarter‑million adults and 21 variables ranging from self‑rated health to blood pressure, cholesterol, weight, mobility, and access to care. The second is the classic Pima Indians Diabetes dataset, a much smaller clinical study of 768 women with eight laboratory and exam measurements, such as blood glucose, insulin, body‑mass index, and age. On the large survey, the new method cuts the number of predictors roughly in half, from 21 down to 10, yet still powers models that almost match the performance of using all variables and clearly outperform several standard selection techniques. On the compact Pima data, where there are only eight potential predictors to begin with, all methods use the same set of variables; here, the new ranking performs as well as strong competitors and even yields the numerically highest discrimination score for one of the tested models.
What the method learns about diabetes risk
Beyond raw accuracy, the selected predictors line up with clinical intuition. In the national survey, the tail‑focused method consistently elevates poor self‑rated general health, high blood pressure and cholesterol, high body‑mass index, older age, prior heart disease or stroke, difficulty walking, and days of poor physical health—exactly the kinds of burdens that cluster in people at greatest risk. In the Pima study, it highlights extremely high blood glucose, excess body weight, and older age, followed by insulin levels and a family‑history score. The researchers also stress‑test their models by adding noise, flipping a fraction of the labels, and introducing missing values; performance degrades only slightly, suggesting that the approach is robust enough for noisy real‑world data.
How this can help patients and clinicians
For a non‑specialist, the take‑home message is that not all risk factors are created equal, and the ones that matter most for those on the brink of diabetes can be identified by looking specifically at the extremes. The proposed method offers a fast, transparent way to screen large health datasets and spotlight variables that rise together with the disease in the highest‑risk strata. Used alongside established techniques, it can help public health teams and clinicians build simpler models that focus on the most telling warning signs—such as very poor overall health, severe obesity, and cardiovascular problems—so that prevention efforts and resources can be directed where they are likely to make the greatest difference.
Citation: Aich, A., Murshed, M.M., Hewage, S. et al. A copula based supervised filter for feature selection in machine learning driven diabetes risk prediction. Sci Rep 16, 12132 (2026). https://doi.org/10.1038/s41598-026-41874-9
Keywords: diabetes risk prediction, feature selection, tail dependence, medical machine learning, copula methods