Clear Sky Science · en
The nonlinear relationship between urban design form and energy efficiency
Why City Shape Matters for Energy and Climate
Most of us experience city shape without thinking about it: long drives from distant suburbs, crowded subway rides, or the cool shade of tall buildings on a hot day. This study asks a deceptively simple question with big climate implications: how does the way a city is laid out—its density, street network, and mix of uses—really affect how much energy it takes to run that city? Focusing on nearly 300 cities in China, the authors show that the link between urban design and energy efficiency is not a straight line, but follows a three-stage S-shaped curve that can either lock cities into high-carbon futures or help them become cleaner and more resilient.
Putting City Shape into One Clear Score
To move beyond vague ideas like “compact” or “sprawling,” the researchers build a single measure of city shape called the Integrated Urban Form Index. It combines three features that planners often discuss separately: how densely people and buildings are packed together (compactness), how well the street network connects different areas (connectivity), and how varied the land uses are, such as homes, jobs, and services mingled together (complexity). Using detailed data for 285 cities from 2011 to 2023, they translate these ingredients into a statistically grounded score that captures how physically “mature” or integrated a city’s layout has become. This index is then compared with a broad measure of how efficiently each city turns labor, capital, and energy into economic output while limiting carbon emissions.
An S-Shaped Path from Wasteful to Efficient
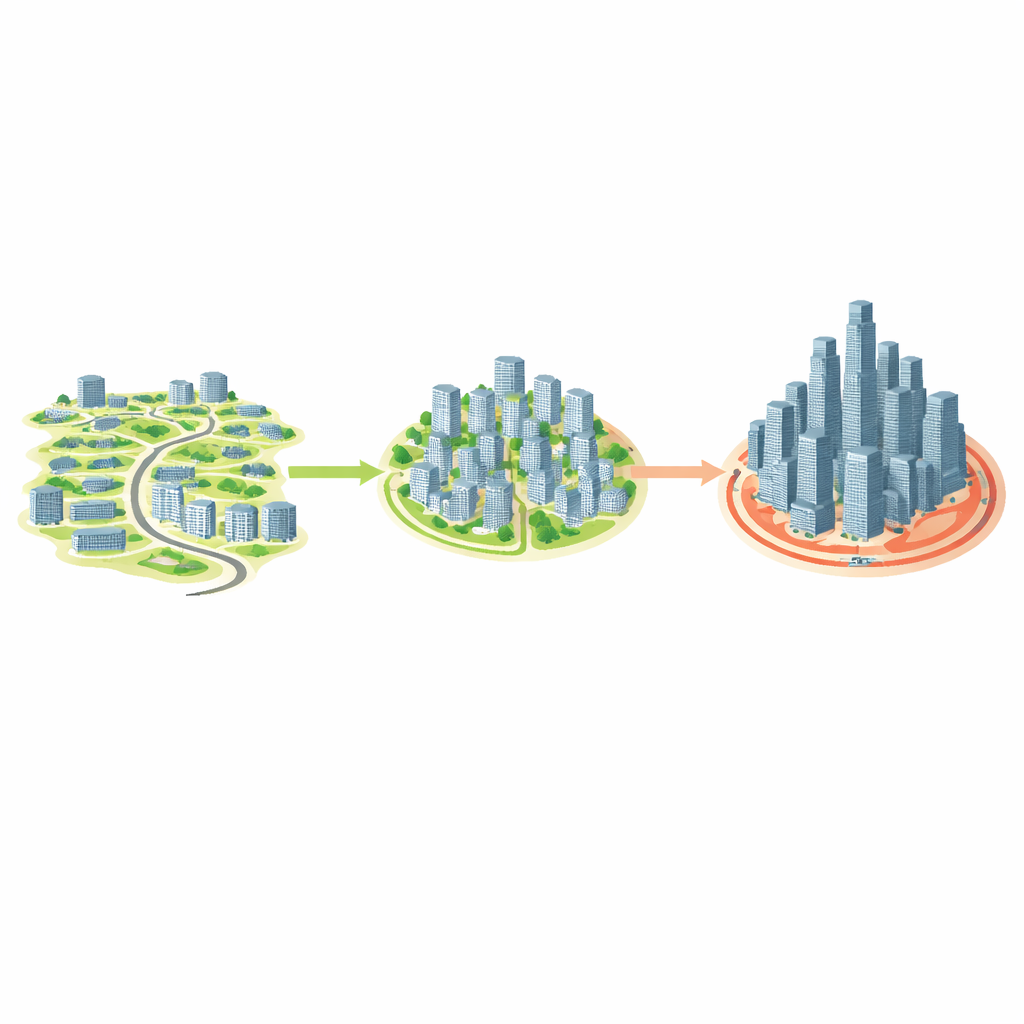
When the authors plot city shape against energy efficiency, they find a distinctive S-shaped pattern instead of a smooth upward line. At low levels of compactness and connectivity, improving the layout has surprisingly little impact: loosely built cities stuck in car-dependent sprawl see only modest gains, a “latent” stage where early upgrades face strong friction. Once cities cross a first tipping point, however, improvements in form start to pay off rapidly. Travel distances shrink, public transit works better, and dense clusters of activity emerge, pushing efficiency up quickly in an “acceleration” stage. Yet this surge does not continue forever. Beyond a second threshold, further crowding and intensification still help somewhat, but traffic congestion, overheating, and other side effects grow, so the benefits taper off in a “saturation” phase rather than rising without limit.
How Streets and Clusters Drive the Curve
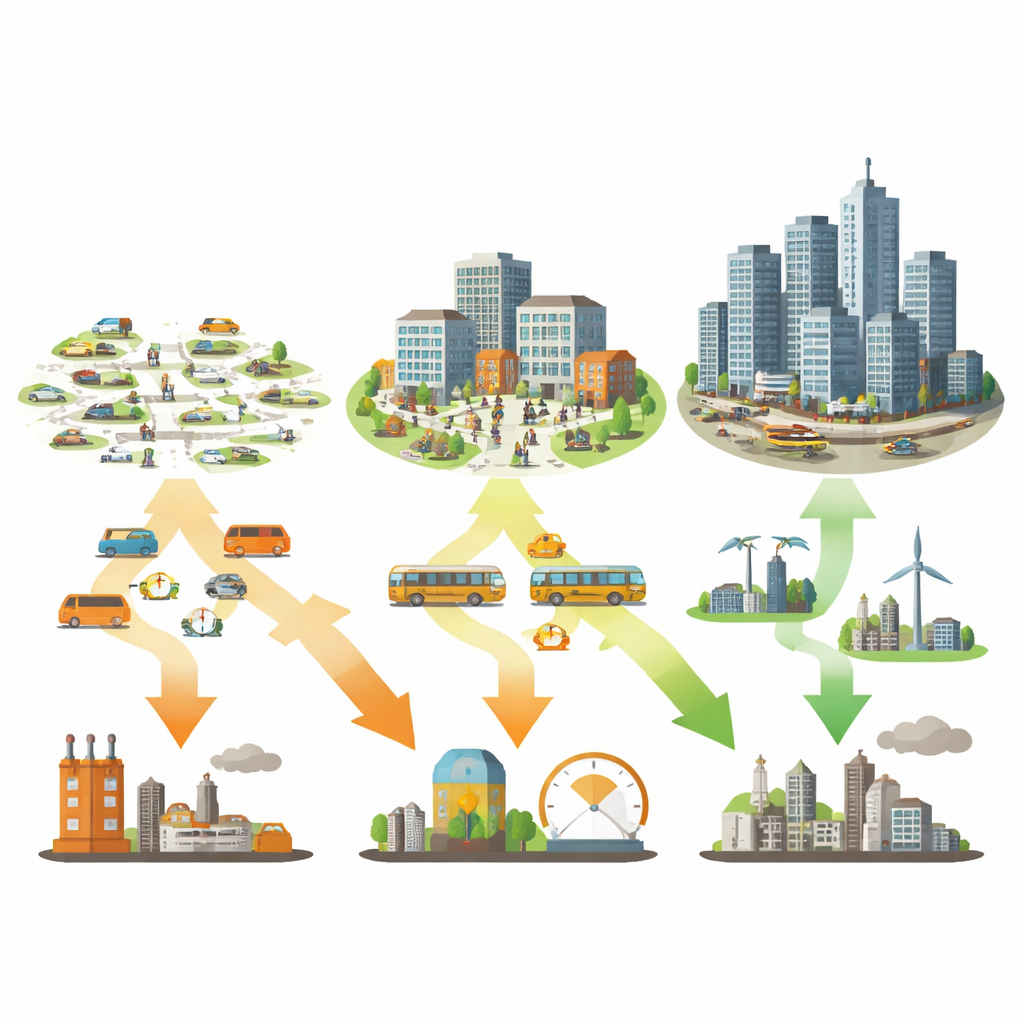
Behind this S-shaped curve lie two intertwined forces. The first is the way city layout shapes everyday travel. More compact, well-connected neighborhoods make walking, cycling, and transit more attractive, cutting fuel use for transport; scattered blocks and super-sized roads do the opposite. The second force is economic clustering: when activities are close together, shared infrastructure such as district heating, transit hubs, and waste systems becomes more efficient, and knowledge and services are easier to share. Using statistical models, the study shows that both travel savings and clustering benefits strengthen as cities move into the acceleration stage, then start to clash in very dense megacities where congestion and crowding erode some of the gains. This mix of reinforcing and competing effects explains why the curve bends first upward, then flattens.
Different Cities, Different Design Priorities
Because cities sit at different points on this S-shaped path, a one-size-fits-all design recipe will not work. Smaller and medium-sized cities, which often remain in the early “latent” zone, need strategies that push them decisively past the first threshold. That means avoiding low-density sprawl, concentrating new growth along transit, and mixing housing with jobs and services so that sustainable travel patterns take root early. By contrast, large and mega-cities near or beyond the saturation point can no longer rely on simply adding more buildings and people. For them, the priority shifts to reorganizing what is already built: easing pressure on overloaded centers through polycentric networks of sub-centers, improving local access with walkable “15-minute” districts, and weaving green and blue spaces into dense areas to relieve heat and pollution stress.
What This Means for Future Low-Carbon Cities
In plain terms, the study shows that how a city grows matters as much as how big it gets. Thoughtful design of density, streets, and land-use mix can dramatically improve energy efficiency—but only when a city crosses key thresholds, and only up to a point. Early in their growth, cities must deliberately steer away from car-oriented sprawl so they do not get stuck in a high-carbon mold. Later, when they are already dense, cities must fine-tune and rebalance instead of just piling on more development. By revealing the full S-shaped journey from wasteful sprawl to efficient but potentially stressed megacities, this research gives planners a roadmap for matching design choices to each city’s stage, helping them cut emissions while building livable, resilient urban environments.
Citation: Lyu, S., Yan, F. The nonlinear relationship between urban design form and energy efficiency. Sci Rep 16, 11178 (2026). https://doi.org/10.1038/s41598-026-41779-7
Keywords: urban form, energy efficiency, city planning, compact cities, low-carbon development