Clear Sky Science · en
Wheat yield prediction using integrated optical and radar remote sensing with machine learning across key phenological stages
Why this matters for our food future
Feeding a growing world in a warming, water‑stressed climate depends on knowing how much grain farmers will harvest long before combines enter the fields. This study shows how scientists can estimate wheat yields in a dry region of Iran using satellites and artificial intelligence, delivering reliable forecasts about 50 days before harvest—early enough to guide water use, fertilizer, trade decisions, and efforts to prevent shortages.
A dry plain under pressure
The work focuses on the Qazvin Plain, a major wheat‑growing area in northern Iran that is both highly productive and chronically short on water. Rainfall is low and erratic, temperatures are high, and farmers rely heavily on limited groundwater and mountain runoff. In such arid landscapes, guessing yields from past experience or simple weather statistics is risky. Traditional crop models demand detailed data on soils, management, and climate that are often unavailable. The authors instead turned to what is plentiful: satellite images that record how bright and green fields look across large areas, week after week.
Seeing crop health from space
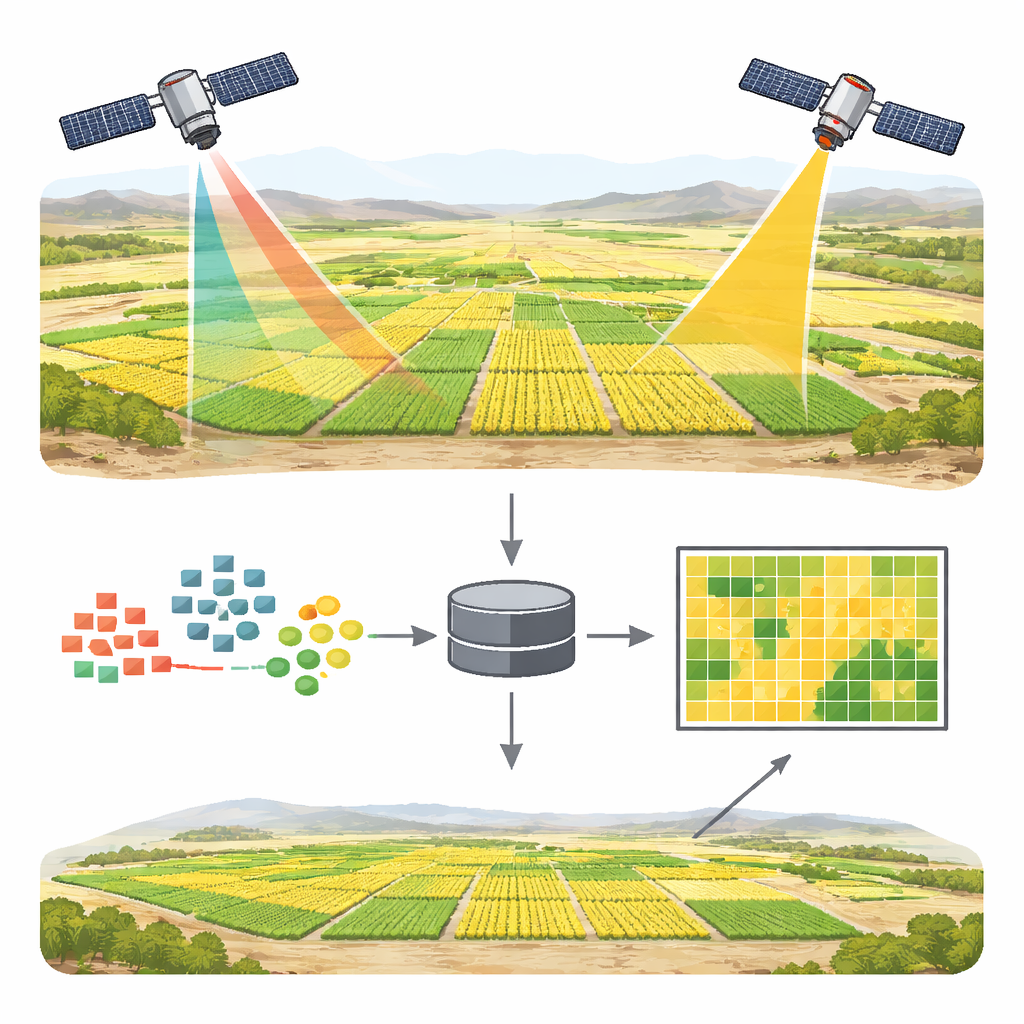
The team combined optical images from the European Sentinel‑2 satellites with radar images from Sentinel‑1. Optical sensors behave like very sharp digital cameras, capturing reflected sunlight in several colors, from blue to near‑infrared. From these colors they computed 16 different “greenness” and moisture‑related indicators that reveal how dense, leafy, and water‑stressed the wheat canopy is. They focused on two key growth moments: the Tillering stage in mid‑April, when plants produce shoots that set yield potential, and Anthesis in mid‑May, when the crop reaches peak greenness and prepares to fill grain.
Listening with radar when light is not enough
Radar from Sentinel‑1 adds a different kind of vision. Instead of depending on sunlight, it sends out microwave pulses and measures the echo, which is affected by plant structure and moisture in both vegetation and soil. This is especially appealing in dusty, cloud‑prone, or sparsely vegetated regions, where optical signals can be muddied by bare soil and atmosphere. The researchers derived simple radar‑based indicators from two polarization channels, then blended these with the optical indices and basic terrain information such as elevation, slope, and field orientation.
Teaching machines to recognize yield patterns
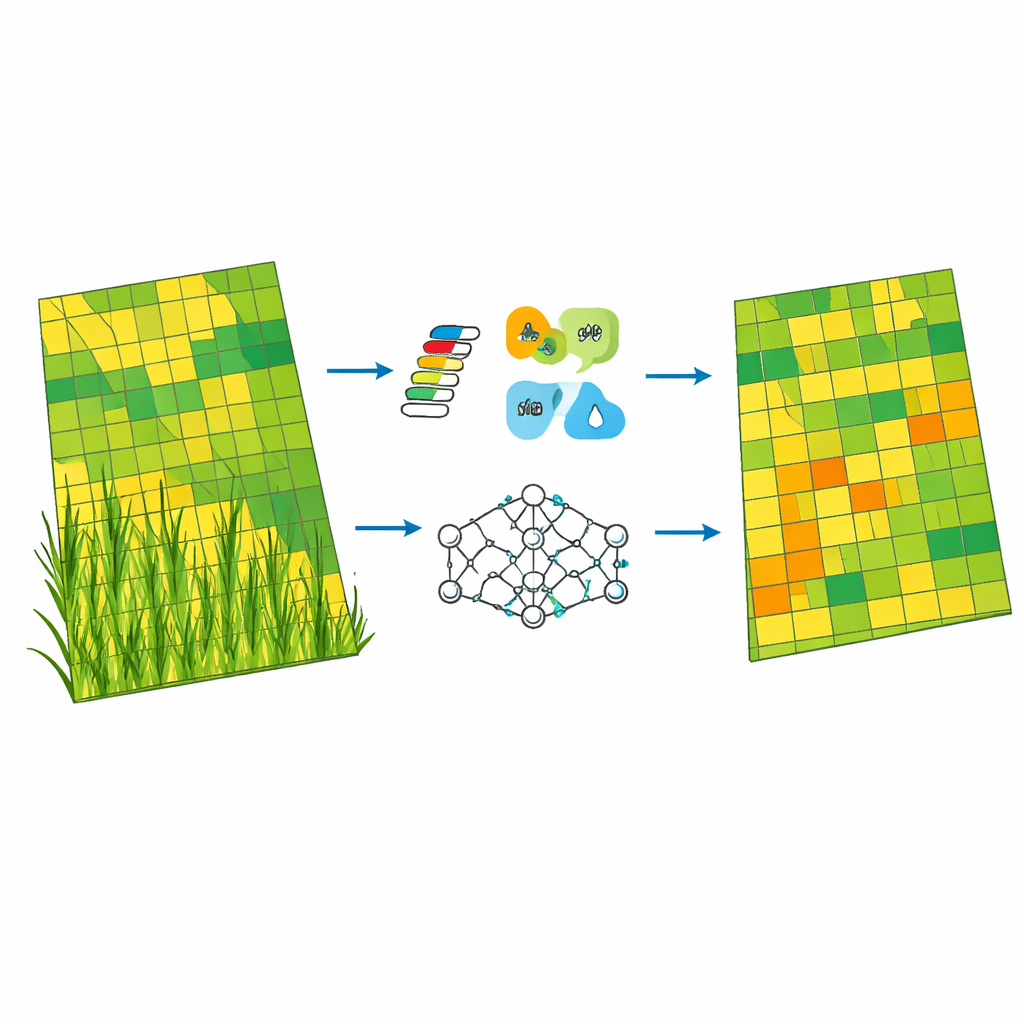
Armed with satellite‑derived variables for 189 well‑measured wheat fields, the authors trained three types of computer models to predict yield: a standard linear regression, a support vector machine that can capture curved relationships, and a random forest, which combines many decision trees. They split the data so that 70% was used to teach the models and 30% to test their skill. Across the board, satellite information from the Anthesis stage proved more informative than from Tillering. The random forest model using only Sentinel‑2 and terrain data at Anthesis performed best, explaining about 90% of the variation in yields in the test fields and missing by only about a third of a ton per hectare on average.
What made the biggest difference
By probing which inputs the random forest relied on most, the study found that indices capturing canopy density, vigor, and water status carried the greatest weight. Measures akin to classic greenness indices and a water‑sensitivity index were top contributors, while raw color bands and terrain variables added relatively little. When radar indicators were folded in, the model fit the training data slightly better—hinting that radar does pick up useful extra detail on moisture and structure—but test errors edged upward. That pattern suggests a modest tendency to overfit, where the model learns noise specific to the training sample rather than general rules. Even so, combining all inputs allowed the researchers to generate a detailed yield map of the entire plain, revealing sharp contrasts between low‑yield pockets and high‑yield zones.
What this means for farmers and planners
Put simply, the study shows that carefully processed optical satellite images, interpreted with a modern machine‑learning method, can deliver accurate, field‑scale wheat yield forecasts in a harsh, water‑scarce environment. Radar adds potentially valuable nuance but, in this case, did not yet beat the simpler optical‑only setup. The resulting early‑season maps can help direct scarce irrigation water and fertilizer to where they matter most, flag vulnerable areas before losses become severe, and inform regional food‑supply planning. While the work centers on one Iranian plain and a single season, the approach offers a blueprint for applying space‑based monitoring and artificial intelligence to bolster food security across arid regions worldwide.
Citation: Navidi, M.N., Fazli, E., Kharazmi, R. et al. Wheat yield prediction using integrated optical and radar remote sensing with machine learning across key phenological stages. Sci Rep 16, 10470 (2026). https://doi.org/10.1038/s41598-026-41501-7
Keywords: wheat yield prediction, remote sensing, satellite agriculture, machine learning, arid regions