Clear Sky Science · en
Geometry quantification for growth assessment of abdominal aortic aneurysms under surveillance
Why silent artery bulges matter
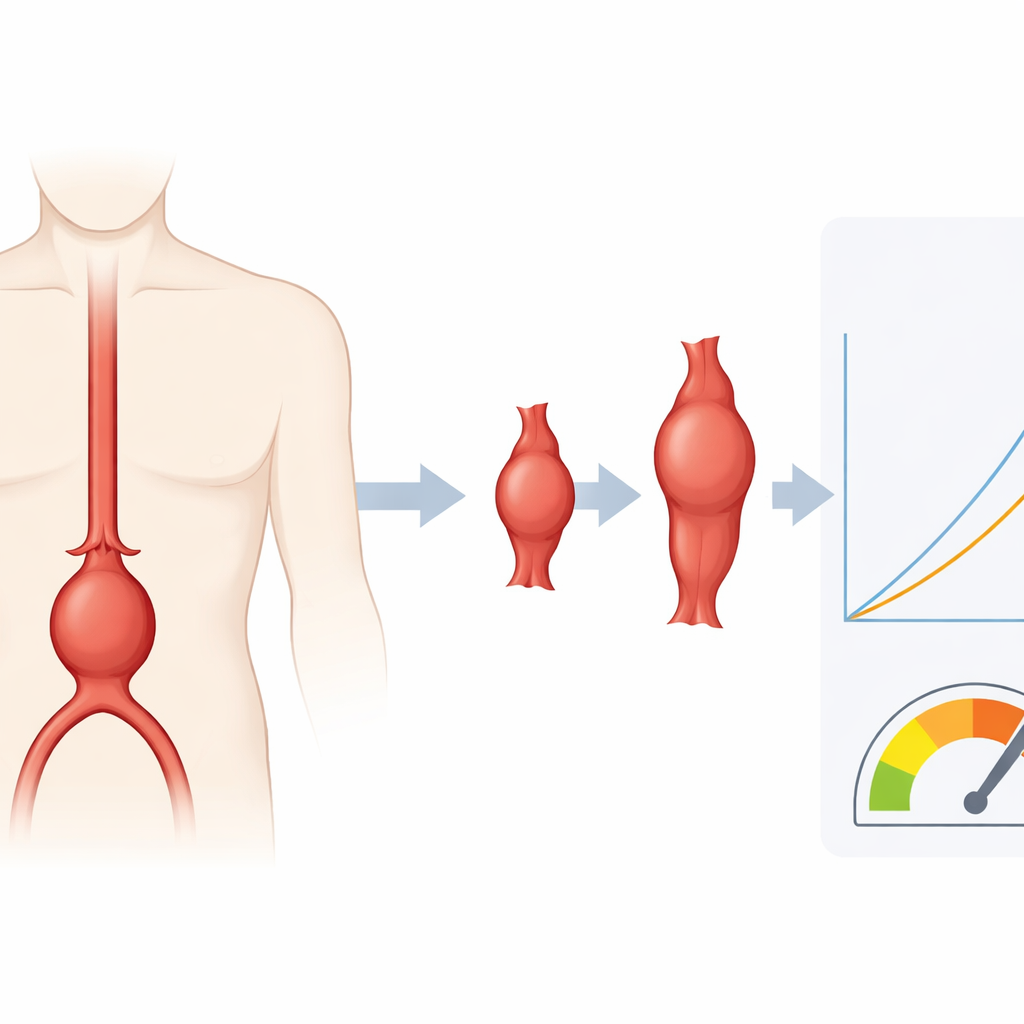
Deep in the abdomen, the body’s main highway for blood can slowly balloon outward without causing pain or obvious symptoms. These bulges, called abdominal aortic aneurysms, can tear without warning and lead to life‑threatening bleeding. Doctors currently track these aneurysms mostly by measuring how wide they are, but this simple yardstick can miss important changes in shape and structure. This study asks a pressing question: can we use richer measurements of aneurysm geometry, and more sophisticated growth models, to better understand how these dangerous bulges evolve over time?
Looking beyond a single width
Patients with aneurysms that are not yet large enough for surgery are usually followed with regular scans. Today, the key number is the maximum diameter of the bulge. Guidelines tell surgeons when to operate based largely on this size and how fast it increases. Yet aneurysms do not grow like perfect cylinders; they twist, lengthen, and fill with soft clot material inside the sac. Prior work has hinted that overall volume and other shape features may change faster, and in more telling ways, than the single largest width can capture. The authors set out to compare many different size and shape measurements, and to test whether aneurysms grow in a steady straight‑line fashion or in a more curved, exponential way.
Following real patients over years
The team analyzed 140 CT scans from 40 people with abdominal aortic aneurysms who were monitored for an average of about two and a half years. Using custom software, they turned each scan into a detailed three‑dimensional model and computed 53 geometric indices, including overall diameter, length, surface area, volume, wall thickness, and features related to intraluminal thrombus, the soft clot that often fills part of the aneurysm. They also estimated how mechanical stress would be distributed over the aneurysm wall under a standard blood pressure, and combined that with a wall‑strength model to form a "geometry‑driven rupture proxy index"—a normalized number that reflects how close the wall might be to failure based on shape alone.
Clot geometry as a key signal
When the researchers examined how the rupture proxy changed with all of the geometric indices, a clear pattern emerged. Measures related to the internal clot—its total volume, average and maximum thickness, and how much of the sac it filled—showed the strongest links with the rupture proxy. In contrast, traditional metrics like maximum diameter and even total volume, while still important, were less tightly connected. This suggests that where and how clot builds up inside the aneurysm may strongly influence how mechanical stress is redistributed over the wall. The study also found that many different growth descriptors were more tightly related when modeled with an exponential law than with a simple straight line, especially for three‑dimensional features such as volume and surface area.
Capturing each patient’s personal path
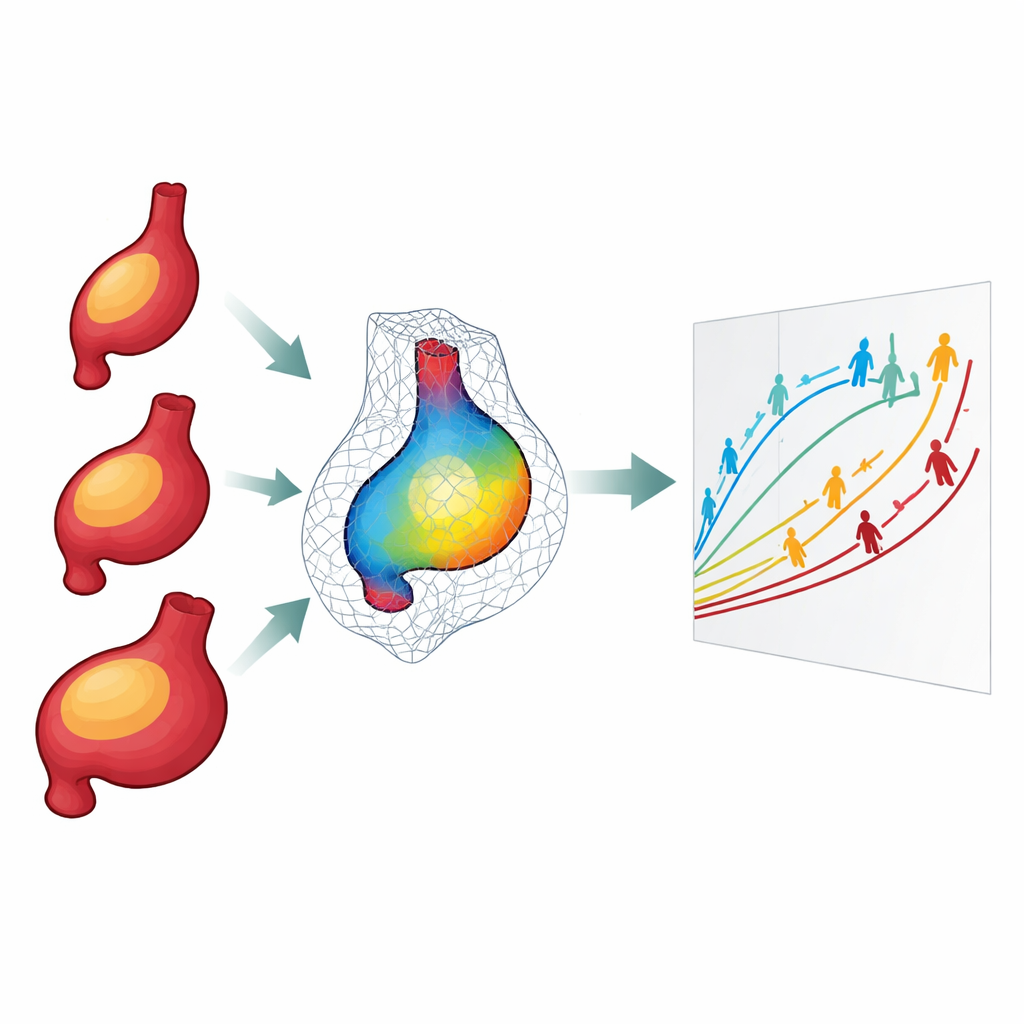
Aneurysm growth, however, is not uniform from person to person. Some sacs grow quickly, others plateau, and a few even show temporary shrinkage in diameter while still gaining volume elsewhere. To handle this diversity, the authors used "mixed effects" models, a statistical approach that combines an overall population trend with individual‑level adjustments. With this framework, both linear and exponential growth models fit the data very well, explaining over 90 percent of the observed changes for key indices like maximum diameter and volume. Purely population‑level models, without patient‑specific adjustments, performed much worse, even when the data were normalized to each patient’s starting size.
What this means for patients and doctors
For people living with an abdominal aortic aneurysm, the findings underscore that risk is about more than how wide the bulge is on a single slice. The build‑up and distribution of soft clot inside the sac, and the resulting changes in wall stress, may provide richer clues about how the aneurysm is evolving. At the same time, the study shows that growth patterns vary widely across patients, and that models which explicitly account for this variability can track progression very accurately whether growth appears linear or exponential. In practical terms, supplementing diameter with clot‑related geometric indicators and mixed‑effects–style growth modeling could eventually help personalize surveillance intervals and intervention decisions, making follow‑up care both safer and more precise.
Citation: Restrepo, J.C., Mitra, P., Park, H. et al. Geometry quantification for growth assessment of abdominal aortic aneurysms under surveillance. Sci Rep 16, 12763 (2026). https://doi.org/10.1038/s41598-026-41340-6
Keywords: abdominal aortic aneurysm, aneurysm growth, vascular imaging, intraluminal thrombus, biomechanical modeling