Clear Sky Science · en
K-means clustering applied to vegetation indices for mapping cultivated areas using high-resolution Moroccan Mohammed VI satellite imagery
Why smarter crop maps matter
Feeding a growing world depends on knowing, in near real time, what is actually growing on the ground. Farmers and governments need reliable maps of where crops are planted, which fields are bare, and how those patterns change season by season. This study shows how a Moroccan Earth‑observation satellite, paired with a simple form of artificial intelligence, can turn raw images into highly accurate maps of cultivated land without requiring armies of people to label data by hand.
Seeing farms from space
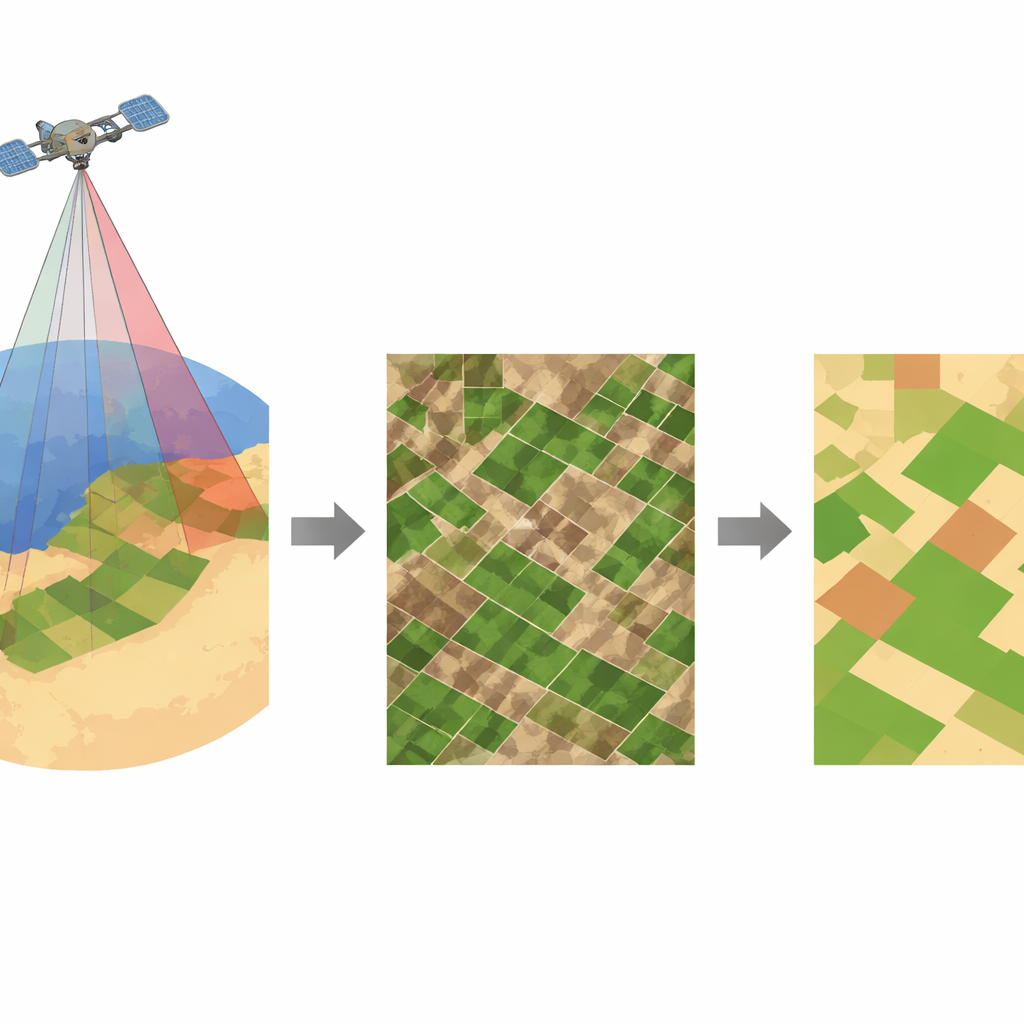
The work centers on the Mohammed VI satellite system, a pair of Moroccan satellites that circle Earth in a sun‑synchronous orbit. They capture very sharp images in four colors, including near‑infrared light, at a resolution of half a meter—fine enough to distinguish individual small fields and even rows of trees. The authors focused on a 175‑hectare agricultural area in the Fes–Meknes region of northern Morocco, where fields of cereals, maize, olives, almonds, grapes and vegetables sit alongside uncultivated plots and sparse vegetation. Such diversity makes the area an ideal test bed for tools that must separate cropped land from everything else.
Turning colors into clues
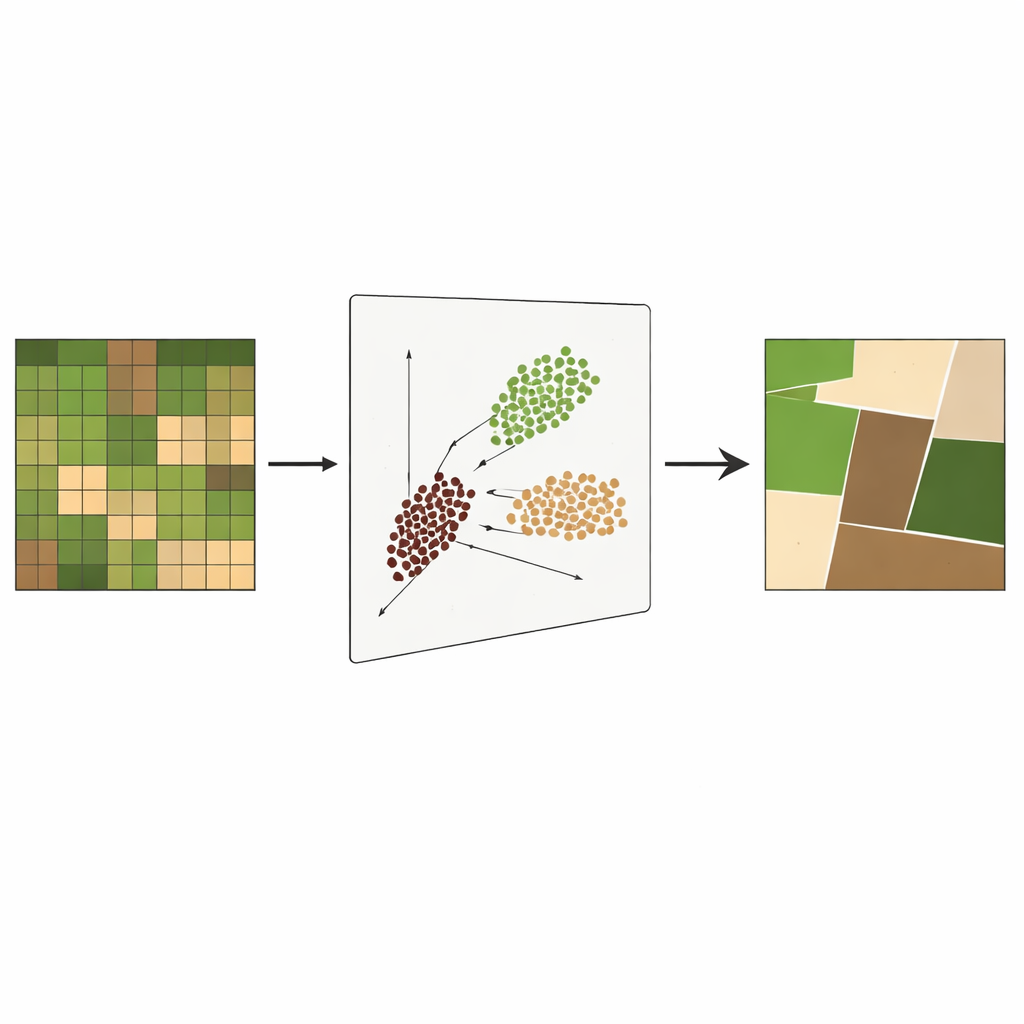
Raw satellite pictures are just grids of brightness values in different color bands. To make those grids more informative, scientists often compute “vegetation indices” that blend several colors into a single number that reflects plant health or water content. This study uses the well‑known Normalized Difference Vegetation Index, which highlights leafy, chlorophyll‑rich vegetation, and the Modified Normalized Difference Water Index, which is sensitive to moisture differences using green and near‑infrared light. Together with the original near‑infrared band, these three layers form a compact description of each pixel’s vegetation and moisture status, giving much richer information than any single band alone.
Letting the data group itself
Instead of training a complex model with thousands of hand‑labeled examples, the researchers turned to K‑means, a straightforward clustering algorithm from unsupervised machine learning. K‑means simply looks for patterns in the data and groups pixels into a fixed number of clusters that share similar spectral traits. After basic preprocessing—extracting the relevant bands, computing the two indices, stacking them, and scaling all values between zero and one—the team instructed K‑means to create exactly three clusters. These were then interpreted as background (areas outside the fields or with no useful signal), bare soil, and crop‑dominated areas. Because the method is unsupervised, it can be applied to new images without additional labeled training data.
Putting the method to the test
To judge how well the approach worked, the authors created a detailed reference map by manually tracing cultivated parcels in geographic information software, using the same high‑resolution image. They then compared four ways of estimating the share of cultivated land: a simple rule based only on near‑infrared brightness, a rule based only on the vegetation index NDVI, a standard K‑means run on the original color bands, and their new “spectral K‑means” that clusters the combined index‑and‑infrared data. The true cultivated fraction of the study area was 71.07 percent. Near‑infrared thresholding underestimated this at 65.59 percent, NDVI alone gave 66.13 percent, and standard K‑means reached 67.18 percent. The spectral K‑means approach came closest, at 72.07 percent, corresponding to a relative error of just 1.41 percent—several times better than the competing methods.
What this means for future farming
For farmers, water managers and planners, this kind of automated, accurate mapping offers a practical way to monitor fields across large regions without costly field surveys or massive labeled datasets. By reliably distinguishing cropped from uncropped land and highlighting where vegetation is thriving or stressed, the method can support precision irrigation, guide fertilizer use and help track land‑use change. Although the current validation relies on a single image, the approach points toward a future in which simple, unsupervised algorithms applied to high‑resolution satellite data routinely deliver field‑scale crop maps, improving food production while supporting more sustainable use of land and water.
Citation: Moussaid, A., Bayad, M., Gamoussi, Y. et al. K-means clustering applied to vegetation indices for mapping cultivated areas using high-resolution Moroccan Mohammed VI satellite imagery. Sci Rep 16, 11040 (2026). https://doi.org/10.1038/s41598-026-41167-1
Keywords: precision agriculture, satellite imagery, crop mapping, unsupervised learning, vegetation indices