Clear Sky Science · en
UV Index from ERA5 reanalysis
Why Sunlight Safety Depends on Better Numbers
Most of us know the UV Index from weather apps and beach reports that warn when the sun is strong enough to burn. But behind that single number lies a complex mix of atmosphere, clouds, and sunlight. This paper explains how scientists can now compute the UV Index anywhere on Earth and for any hour since 1940 using an existing global climate dataset, without needing extra satellite or ground instruments. That opens the door to better long‑term maps of sun exposure, improved public‑health guidance, and new ways to study how sunlight affects skin cancer, vitamin D, and even airborne diseases.
Turning Raw Sunlight into a Health Risk Number
The UV Index is designed as a simple scale that tells people how quickly unprotected skin can burn in the sun. To calculate it, scientists start from the intensity of ultraviolet (UV) light at each wavelength and weight it according to how damaging that wavelength is to human skin. Adding up this weighted spectrum gives what is known as erythemal radiation, which is then scaled into the familiar UV Index. The widely used ERA5 climate reanalysis, produced by the Copernicus Climate Change Service, already provides hourly UV radiation at the ground, but only as a broad‑band energy value, not directly as the UV Index. This missing link means users must perform their own complex conversions or rely on separate products with coarser resolution or shorter time spans.

Building a Simple Bridge from Climate Data to Daily Risk
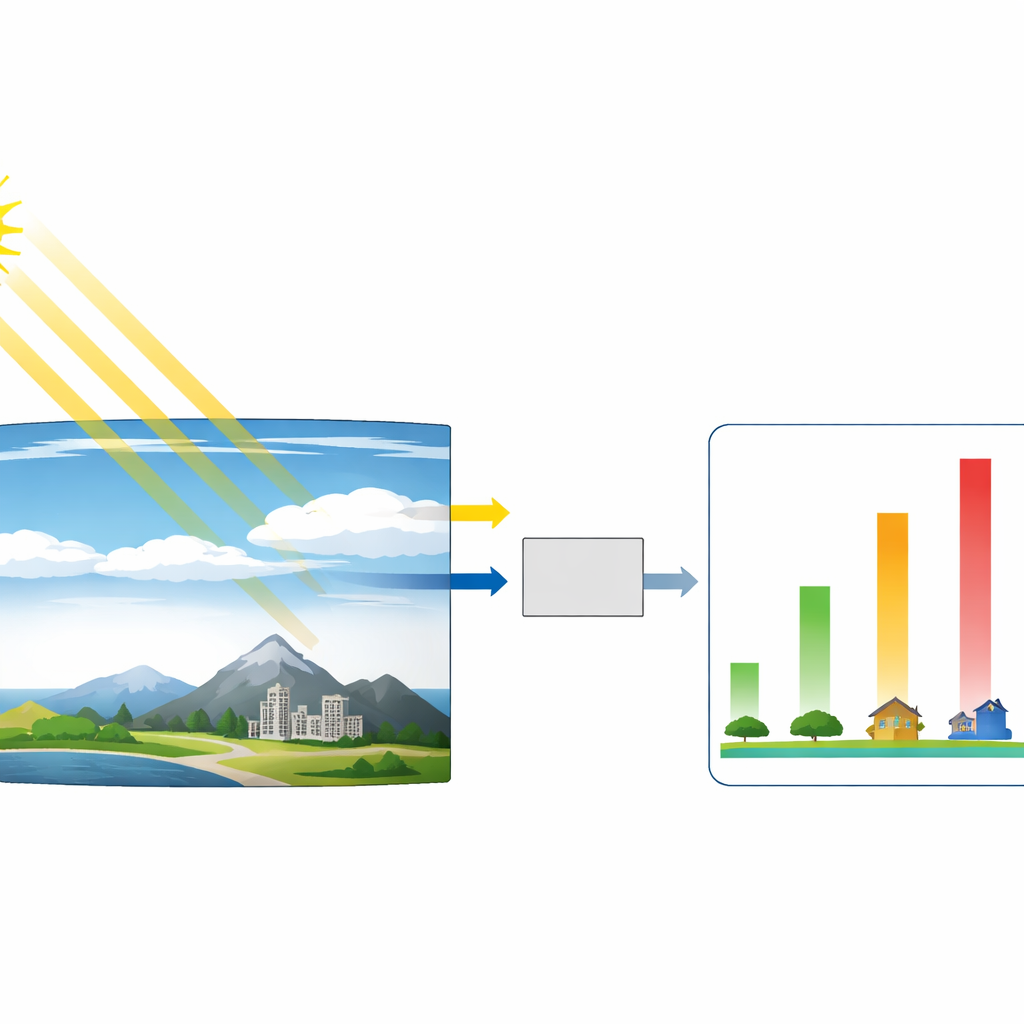
The authors set out to create a practical formula that converts ERA5’s broad‑band UV radiation into the UV Index using only quantities already present in ERA5. They used a detailed radiative transfer code, which simulates how sunlight passes through the atmosphere, to generate thousands of “clear‑sky” examples under many conditions: different latitudes, seasons, ground heights, surface brightness, air clarity, and amounts of ozone. For each simulation they computed both the ERA5‑like UV energy and the true UV Index, then examined their ratio to see which factors mattered most. Many influences—such as aerosol type, general atmosphere type, and surface brightness—turned out to affect both quantities in nearly the same way and largely cancelled out in the ratio.
How Sun Angle and Ozone Control Sunburn Risk
The analysis revealed two key drivers of the link between general UV radiation and the UV Index: how high the sun is in the sky, and how much ozone lies overhead. When the sun is high, its rays travel a shorter path through the atmosphere; when ozone is scarce, more harmful UV reaches the ground. The researchers combined these effects into a single parameter: the cosine of the solar zenith angle divided by the total ozone amount. They showed that the ratio of UV Index to broad‑band UV correlates almost perfectly with this parameter. Using linear regression, they derived a compact formula that predicts the UV Index from ERA5 UV radiation, sun angle, and ozone, with an excellent statistical fit for values up to UV Index 12, which covers conditions typical of most inhabited mid‑latitude and tropical regions.
Testing the Method Against Real‑World Measurements
To check whether the new formula works outside the computer, the team compared its UV Index estimates with more than 17,000 hourly measurements from six ground stations in Europe and with over 6,000 values from an independent Copernicus UV product (CAMS). Under clear skies, the model closely matched both ground data and CAMS: typical errors were well below one UV Index unit, with a small tendency to slightly overestimate. Under cloudy skies, differences grew—especially when cloud cover exceeded about 40 percent—because clouds can locally block or enhance sunlight in ways that are hard to capture with large grid cells. Still, when the UV Index was moderate to extreme, the relative error generally stayed below about 15–20 percent, comparable to the uncertainty of many UV instruments.
What This Means for Everyday Sun Awareness
In plain terms, the authors show that a simple, transparent formula can reliably translate an existing global climate archive into hourly UV Index values for more than eight decades and across the globe, especially when skies are clear or only partly cloudy. While thick and patchy clouds remain a challenge, the method is accurate enough for most public‑health uses, such as mapping where and when people face the highest risk of sunburn or studying long‑term links between UV exposure and disease. Because it requires no new measurements and can be automated, this approach could be built directly into the ERA5 service, giving scientists, health agencies, and the public easier access to detailed, historical and real‑time UV Index information.
Citation: Teggi, S., Costanzini, S., Despini, F. et al. UV Index from ERA5 reanalysis. Sci Rep 16, 12950 (2026). https://doi.org/10.1038/s41598-026-40878-9
Keywords: UV Index, ERA5 reanalysis, ultraviolet radiation, ozone layer, public health