Clear Sky Science · en
Hybrid spatiotemporal modeling of nutrient cycling in wetland ecosystems using advanced mapping techniques and machine learning approaches
Why these hidden water filters matter
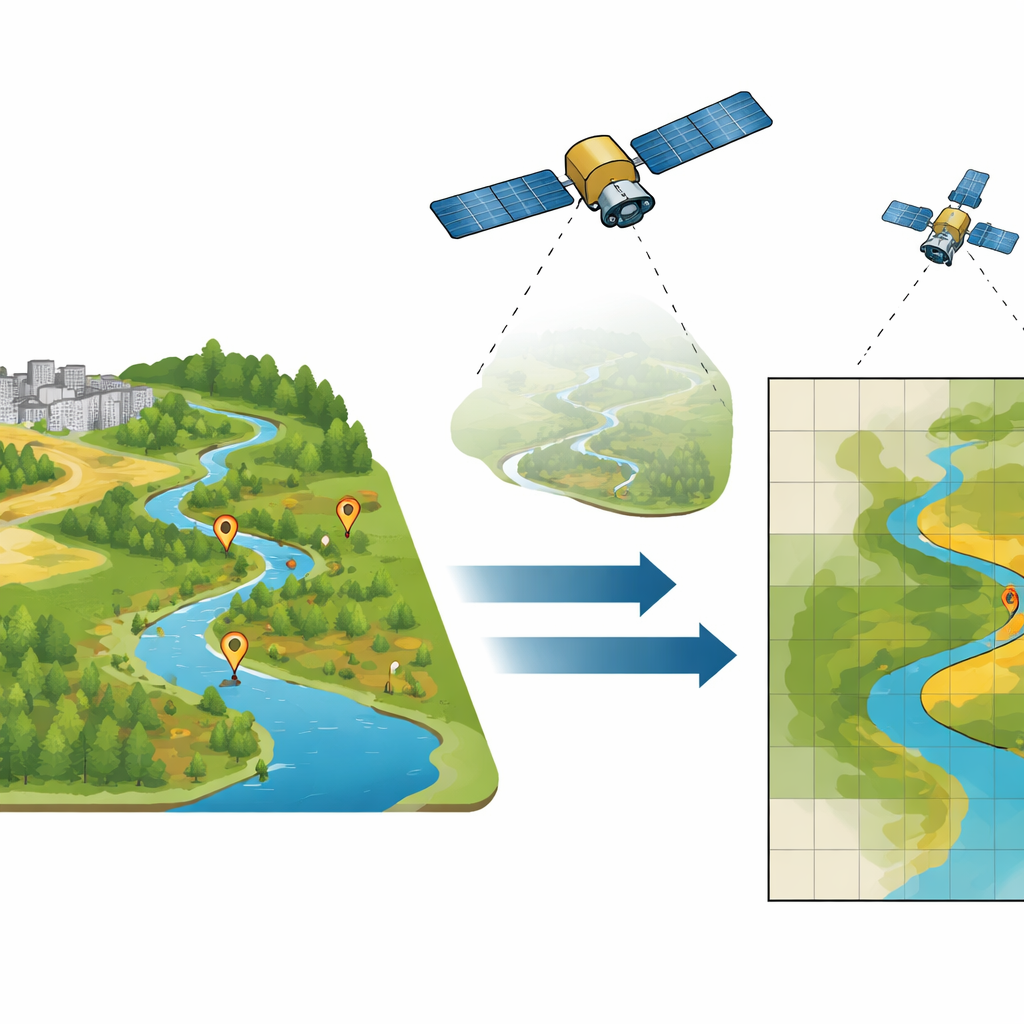
Wetlands quietly protect our rivers and drinking water by soaking up excess fertilizers and other pollutants that wash off farms and cities. But because they are sprawling, soggy, and hard to reach, scientists have struggled to see how well these natural filters are working through time. This study shows how a mix of on-the-ground water sampling, satellite images, and machine learning can turn one small wetland system in Ohio into a detailed, moving picture of its health, season by season and year by year.
Watching nutrients from space and on foot
The researchers focused on the Beavercreek Wetlands Greenway in Ohio, a patchwork landscape where city neighborhoods, farm fields, forests, and marshes meet. They collected monthly water samples for four years from three wetlands along a stream, measuring two key nutrients: nitrogen and phosphorus. In moderate amounts, these nutrients support plant life, but in excess they can trigger algal blooms and rob water of oxygen. To move beyond scattered sampling points, the team paired these measurements with high-resolution satellite data from the European Sentinel-1 and Sentinel-2 missions, all processed in Google Earth Engine.
A two-step way to read the landscape
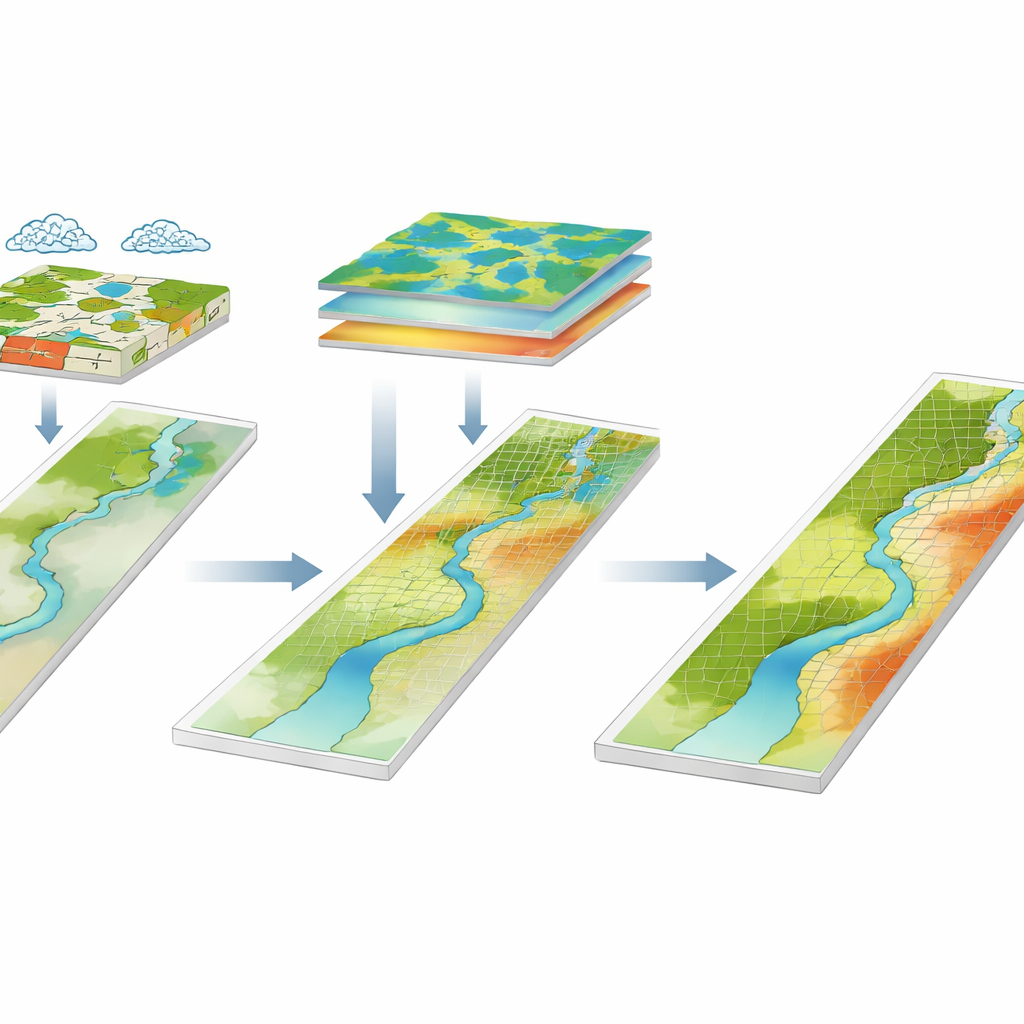
Instead of feeding every type of data into one big model, the authors built a two-stage machine learning framework based on a popular algorithm called Random Forest. In the first stage, the model predicted nutrient levels using broad wetland traits such as shape, size, surrounding land uses (like forest, cropland, or developed areas), and recent rainfall and temperature. This created a “baseline” map that captured how the overall landscape tends to load or absorb nutrients. In the second stage, a separate model focused only on what the first one missed: the remaining spatial errors. It tried to explain these finer patterns using continuous satellite-derived variables, such as vegetation indices and radar-based measures of water and plant structure.
Seasonal stress and signs of recovery
By combining both stages, the team produced quarterly maps of nitrogen and phosphorus from 2021 through 2024 at a resolution fine enough to see changes along the length of the wetlands. Nitrogen showed strong and recurring seasonal swings, with higher concentrations in spring and summer (the second and third quarters) and lower values in the colder months. Over the four years, early-year nitrogen levels crept upward, and midyear peaks in 2022 and 2023 were especially high, signaling repeated seasonal stress tied to wetter months and farming activity in the surrounding catchment.
Different nutrient, different story
Phosphorus told a contrasting story. In 2021, phosphorus concentrations were elevated across much of the wetland system, but the maps revealed a steady decline in most areas through 2022, 2023, and 2024, particularly in winter quarters. A persistent hotspot remained in the wider middle reach of the wetland, especially during late-summer low-flow periods, suggesting internal release of stored phosphorus from sediments. By analyzing which variables the models relied on most, the researchers found that nitrogen depended on both landscape context and local in-stream conditions captured by satellites, while phosphorus was driven mainly by where developed and agricultural lands sit around the wetlands.
What this means for protecting wetlands
To a non-specialist, the key message is that not all nutrient problems are created equal, and satellites can help tell them apart. The new framework accurately tracked nitrogen and phosphorus over space and time, showing that nitrogen remains a diffuse, seasonally recurring issue tied to farming practices and wetland vegetation, whereas phosphorus has improved noticeably as loads from surrounding developed areas have lessened, aside from a stubborn hotspot. This two-step, map-based approach offers managers a practical diagnostic tool: it can quickly highlight trouble spots, indicate whether solutions should focus on land-use change, urban runoff controls, or in-wetland processes, and be adapted to other water quality concerns as climate, land use, and conservation efforts continue to reshape our wetlands.
Citation: Salas, E.A.L., Schrack, K., Kumaran, S.S. et al. Hybrid spatiotemporal modeling of nutrient cycling in wetland ecosystems using advanced mapping techniques and machine learning approaches. Sci Rep 16, 9954 (2026). https://doi.org/10.1038/s41598-026-40585-5
Keywords: wetlands, nutrient pollution, remote sensing, machine learning, water quality