Clear Sky Science · en
An interpretable piecewise model for human mortality: the Christopher–Samba model
Why This Matters For Everyday Life
How your chances of dying change as you age may sound morbid, but it quietly shapes everything from pension systems and life insurance premiums to hospital planning and public health policy. This paper introduces a new way to describe those changing risks over a lifetime using just a few easy‑to‑understand numbers. By making these patterns clearer and more comparable between countries and across time, the model helps us see how improvements in medicine, living standards, and aging are reshaping human lifespans.
A Simple Picture Of Life And Death
Across the world, human mortality follows a surprisingly regular pattern. The risk of death is high right after birth, falls quickly in early childhood, stays very low through young adulthood, then climbs again as people grow older, eventually rising steeply in old age. Traditional mathematical models can reproduce this overall shape, but they often rely on many abstract parameters that are hard to interpret for non‑specialists and even for policymakers. This makes it difficult to use model results directly when comparing countries, monitoring progress, or planning for future health and pension needs.

A Two‑Part View Of The Life Course
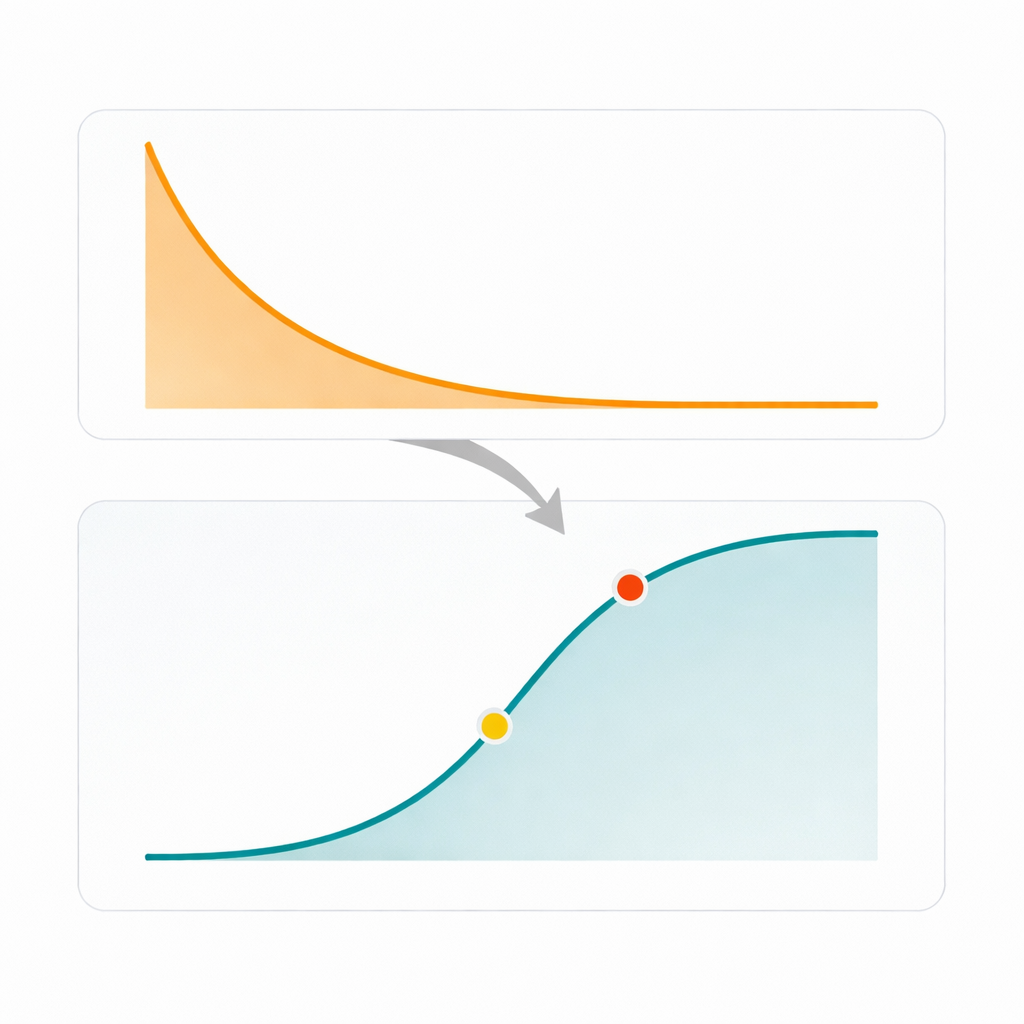
The authors propose the Christopher–Samba (C–S) model, a new “piecewise” approach that treats early childhood and the rest of life separately. The first part focuses on ages 0 to 5. Here, the risk of death declines in a smooth, exponential fashion, capturing the rapid improvements in survival that occur after the fragile newborn period. Two parameters describe this phase: one reflects the chance of dying in the first year of life, and the other describes how fast that risk falls from one year to the next. Together, they provide a compact summary of infant and child survival conditions in a population.
Key Turning Points In Aging
After age 5, the C–S model switches to a reworked version of a logistic curve, which rises slowly at first and then more steeply at older ages before leveling off. Instead of using opaque mathematical constants, the authors re‑express this curve in terms of two concrete ages. The first is the age at which the yearly chance of dying reaches about 1 percent, which they call the onset of increased mortality. The second is the age at which that chance reaches about 10 percent, described as the age of severe mortality. These two ages act like signposts along the road of aging, marking when death risk first begins to matter for population change and when it becomes very high for the few who reach extreme old age.
What The Model Reveals Across Countries
To test their approach, the authors applied the C–S model to detailed mortality data from ten countries drawn from the Human Mortality Database, including Australia, Canada, Chile, Germany, Hong Kong, Italy, Japan, Korea, the United Kingdom, and the United States. For each country they examined an early year (from 1921 onward) and a recent year around 2020–2023. The model fit the observed data well in all cases and performed about as accurately as several classic mortality models, despite using fewer parameters. The results vividly show familiar historical trends: infant deaths have plummeted from double‑digit percentages in the early twentieth century to well under 1 percent in most high‑income countries today, and survival from one childhood year to the next has improved dramatically.
Shifting Ages Of Risk And Uneven Data
The new parameters also illuminate how aging itself has changed. In countries like Australia, Canada, and the United States, the age at which the yearly risk of death reaches 1 percent has shifted forward by one to three decades, meaning people now spend far more years in a phase of very low mortality. In contrast, the age of severe mortality—the 10 percent threshold—has moved only modestly, typically by less than ten years, and still differs noticeably among countries. Hong Kong and Japan, for example, stand out with particularly late ages for both increased and severe mortality, reflecting their exceptionally long-lived populations. When the authors explored applying the model to countries with poorer or coarser mortality data, such as India, they found that results were less stable, underscoring the need for good‑quality records or careful smoothing methods.
What This Means For Our Understanding Of Longevity
In plain terms, the Christopher–Samba model offers a clean, compact way to describe how the risk of death drops in early life and rises again with age, using four numbers that map directly onto everyday concepts: infant death risk, the speed of improvement in childhood survival, and two milestone ages that mark the start of noticeable mortality and the arrival of very high risk. Because these numbers are easy to interpret and compare, they give researchers, insurers, and policymakers a clearer view of how and when people are dying, how that has changed over the last century, and how it may continue to change as societies age. The model is not a replacement for all others, but it is a practical, interpretable tool that helps translate complex mortality patterns into insights that can guide real‑world decisions.
Citation: Lalromawia, C., Pasupuleti, S.S.R. An interpretable piecewise model for human mortality: the Christopher–Samba model. Sci Rep 16, 12361 (2026). https://doi.org/10.1038/s41598-026-40550-2
Keywords: human mortality, ageing patterns, mortality modelling, life expectancy, public health demography