Clear Sky Science · en
Triple-feature fusion from UAV multispectral imagery enhances species-level mangrove carbon assessment
Why these coastal forests matter
Mangrove forests sit where land meets sea, quietly locking away large amounts of carbon in their wood and muddy soils. Because this “blue carbon” helps slow climate change, governments and conservation groups increasingly want to protect and restore mangroves. But not all mangrove species store carbon in the same way. This study shows how small drones carrying special cameras can not only map different mangrove species along a Chinese coastline, but also estimate how much carbon each species holds above and below ground.
Looking at mangroves from above
The research took place in the Gaoqiao Mangrove Nature Reserve in Yingluo Bay, South China, a large, species-rich protected area. Here, four common mangrove species form a mosaic along the tides, from tall tree stands near the open bay to shrubs along riverbanks and pond edges. Traditionally, estimating how much carbon these forests hold requires people to trek through sticky mud, measure tree sizes, and dig into roots and soils—a slow and costly process. Satellites can see large areas, but often lack the fine detail needed to separate neighboring species or small patches of forest. The team instead flew a low-altitude drone equipped with a multispectral camera that captures not just normal color, but also red-edge and near‑infrared light, which are especially sensitive to leaf chemistry and plant health.
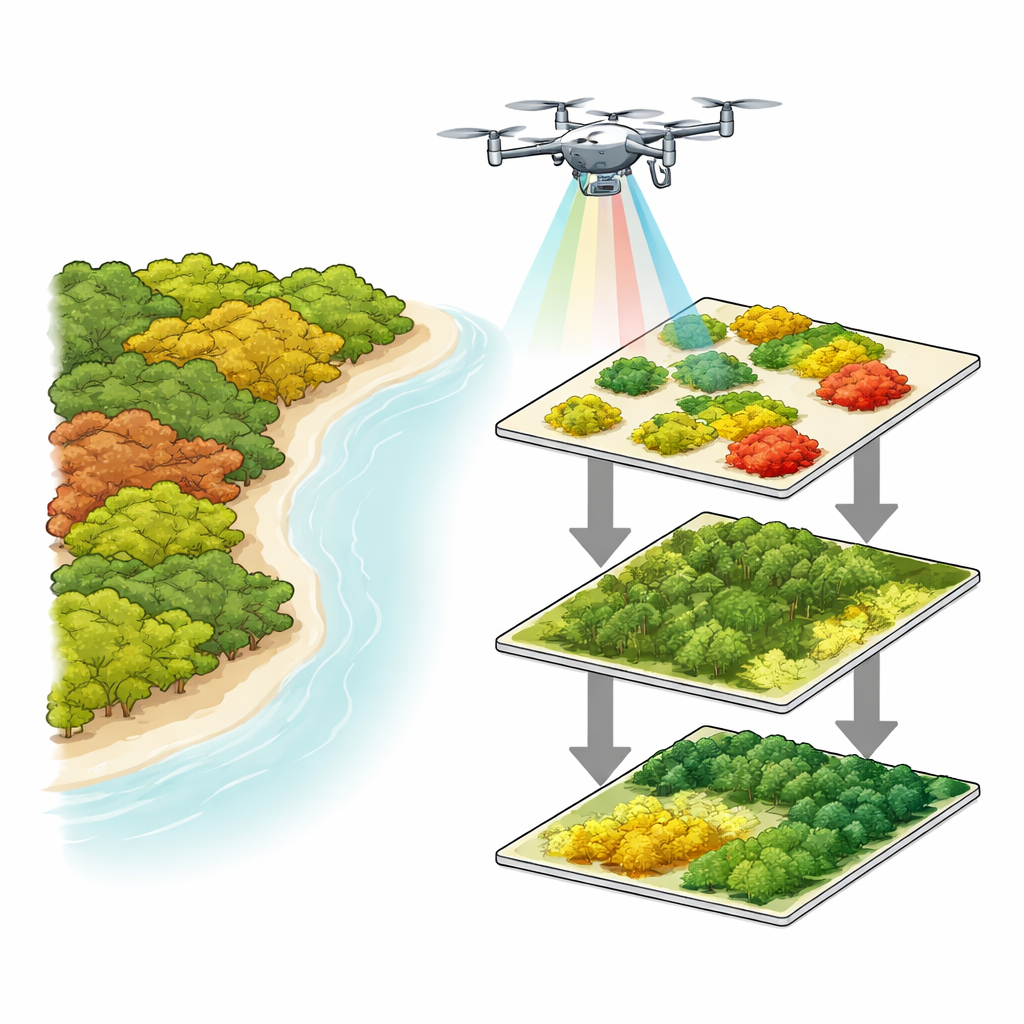
Three kinds of clues from drone images
From the drone data, the scientists extracted three families of clues about the forest. “Spectral” features describe how leaves reflect different colors of light, which can be combined into vegetation indices linked to vigor and chlorophyll. “Structural” features come from 3D height information, revealing how tall the canopy is across the landscape. “Textural” features capture how rough or smooth the canopy appears in the images, reflecting differences in leaf size, branch density, and crown shape. By fusing these three types of information, the researchers trained computer models that first distinguished the four mangrove species and then linked the image features to precise carbon measurements collected in 40 ground plots.
Telling one mangrove from another
The fused approach proved especially powerful for species mapping. When the team used only basic red, green, and blue imagery, the drone could not reliably tell apart species with similar leaf colors or mixed stands. Adding red-edge and near‑infrared bands greatly improved the picture, and including canopy height pushed performance even further. The best combination—raw multispectral bands, vegetation indices, and height—correctly identified mangrove species almost 90% of the time. This was crucial, because species such as Avicennia marina and Aegiceras corniculatum can look spectrally alike but differ subtly in height and growth form, while others, like Rhizophora stylosa and Bruguiera gymnorrhiza, stand taller and have more massive crowns.
Linking forest structure to stored carbon
Once species were mapped, the same triple set of image features was used to build carbon models. For each species or species pair, the researchers tested how well different image variables predicted carbon stored above ground in trunks and branches, and below ground in roots. They found that the most informative features differed by species. For the shrub-like A. corniculatum, subtle patterns in red‑edge texture worked best, while for B. gymnorrhiza, variations in the blue band’s texture were key. For mixed stands of R. stylosa and A. marina, simple canopy height was a strong predictor, reflecting how larger trees hold more biomass. The resulting models explained nearly half to over 90% of the variation in observed carbon, depending on species and whether above- or below‑ground stocks were considered.
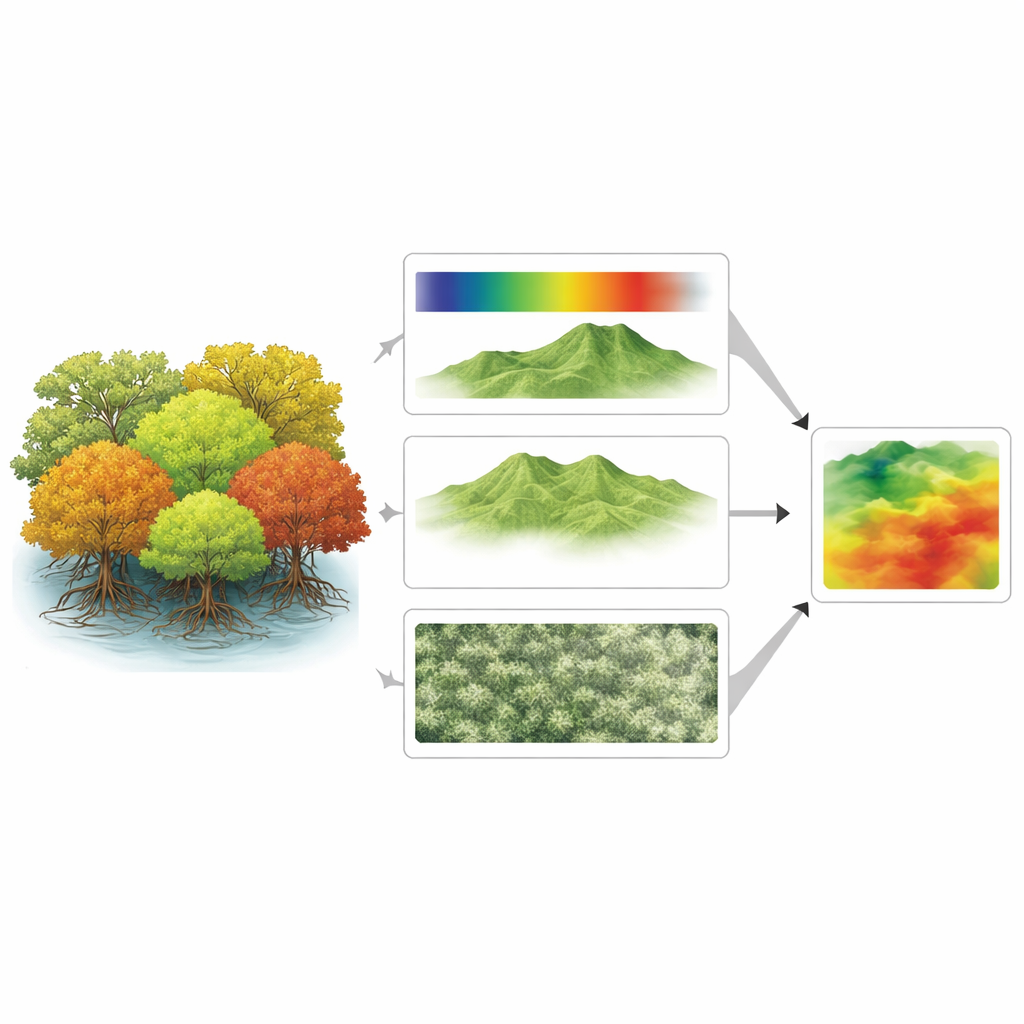
Where the carbon really sits
Applying these models to the entire study area produced detailed maps of above‑ground, below‑ground, and total mangrove carbon. The northwest corner of the reserve, dominated by tall R. stylosa stands, emerged as a carbon hotspot, with the highest values both above and below ground. On average, R. stylosa stored about twice as much above-ground carbon as the smallest‑statured species, A. corniculatum, and also led in root carbon. A. marina, though widely spread, held more moderate carbon per hectare, while B. gymnorrhiza contributed smaller but still important pockets. Overall, species with taller, thicker trunks and broader crowns stored far more carbon than dense thickets of shorter shrubs, despite the shrubs having many more stems per area.
What this means for climate and conservation
To a non‑specialist, the main message is that mangroves cannot be treated as a uniform green band on the map. Different species stockpile very different amounts of carbon, and they respond differently to what drones “see” in color, structure, and texture. By combining these three views, this study shows that relatively affordable drones can map both species and their carbon stocks with high detail, helping managers pinpoint which patches of forest are most valuable for climate mitigation. As efforts to protect and restore blue carbon ecosystems grow, this species‑level insight can guide smarter planting, targeted protection of high‑carbon stands, and more accurate national carbon accounting.
Citation: Chen, Y., Shen, X., Yan, C. et al. Triple-feature fusion from UAV multispectral imagery enhances species-level mangrove carbon assessment. Sci Rep 16, 11494 (2026). https://doi.org/10.1038/s41598-026-40303-1
Keywords: mangrove carbon, blue carbon, UAV multispectral, species mapping, forest remote sensing