Clear Sky Science · en
Comprehensive indicators and fine granularity refine density scaling laws in rural-urban systems
Why city size and crowding matter
Why do some problems, like traffic crashes or crime, seem to grow faster in big cities, while others, such as certain diseases, may actually become less common? This study looks at how life changes as places become more crowded, from remote countryside to busy city centers, using detailed data for all of England and Wales. By tracking crime, health, education, housing and more across thousands of small areas, the authors uncover a surprisingly sharp and consistent "tipping point" where rural patterns give way to urban ones—and show that who lives in a place, not just how many people live there, is crucial for understanding those patterns.

A new way to compare places
Most past work on city size has compared whole cities using their total population. That approach ignores the countryside and smooths over differences within cities themselves. This study instead looks at population density—the number of people per unit of land—and uses it to study the full spectrum from sparsely populated rural districts to the densest inner-city neighborhoods. The authors examine 7,080 small areas in England and Wales, each with its own land area, population and local statistics. For each area, they compute densities for 117 different indicators, covering deaths from various causes, crime types, property sales, road crashes, age structure, ethnic mix, education, jobs, religion and disability.
Finding a hidden tipping point
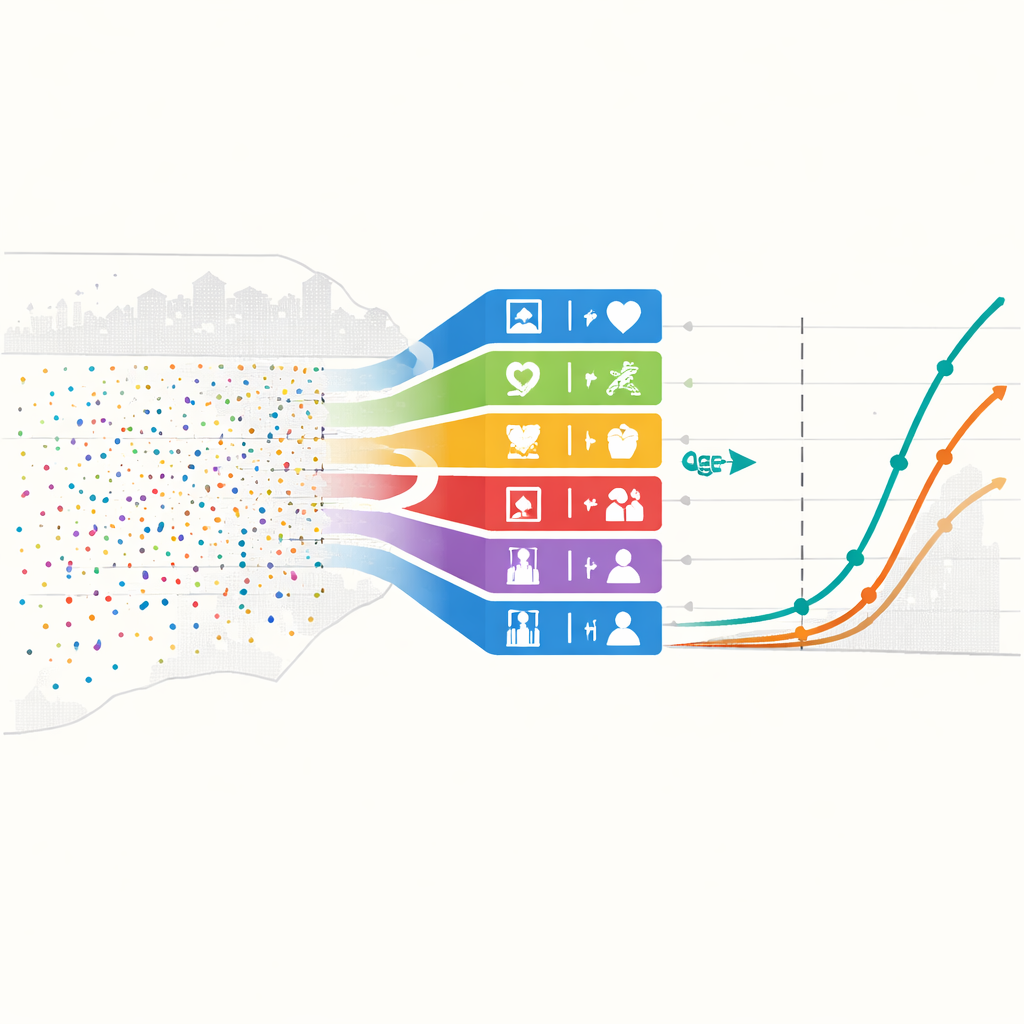
Using statistical models, the team asks whether each indicator changes smoothly with density or instead shows a bend—a breakpoint—where the pattern shifts. For 92 of the 117 indicators, the best description is not a single curve but a segmented one, with a clear change in slope at around 33 people per hectare. Below this level, typical of rural and small-town settings, many quantities grow in one way with density; above it, in more urban settings, they grow differently. For instance, most types of crime, road accidents and many health outcomes follow this two-part pattern. With finer, more local data than earlier studies, the authors even uncover extra bends that had been hidden when larger, more mixed regions were lumped together. They also detect unusual behavior in some crime statistics in Greater Manchester, consistent with independent reports of under-recording—showing how this method can flag local data problems.
Who lives there changes everything
Looking only at total head counts can be misleading because the mix of people changes along the rural–urban gradient. Young adults tend to cluster in dense areas, while older people are relatively more common at lower densities. The study shows that many social traits—such as higher education, job status, religion and disability—also shift strongly with density, and they too have their own breakpoints. Higher-level qualifications grow faster than one would expect in cities, reflecting the pull of universities and skilled jobs, while some groups, such as retirees and people with long-term sickness, become relatively less common in dense zones. Ethnic and religious communities also show characteristic gains or declines with density. These differences mean that a city is not just a larger version of a village; it hosts a different mix of ages, backgrounds and life situations.
Rethinking health risks in cities
The power of this approach becomes clearest when the authors focus on deaths from dementia and from ischaemic heart disease, which at first glance seem to occur less often per person in high-density areas. If one ignored age, this could be read as a general health benefit of cities. However, the team repeats the analysis while looking only at older age bands. They find that the apparent "urban protection" is concentrated in the oldest groups, especially those aged 75 and over, where death rates grow more slowly than expected in dense areas. In younger old-age bands, the pattern looks different. These results suggest that the built environment and services of dense places might offer particular advantages for very old residents—perhaps through easier access to care or more stimulating surroundings—but that such conclusions are impossible without carefully separating age groups.
What this means for planning and policy
Overall, the study shows that there is a robust, shared density threshold separating broadly rural from broadly urban behavior across a wide range of social and health indicators. It also demonstrates that these patterns depend strongly on the detailed makeup of local populations. Treating all residents as interchangeable and relying on simple "per person" measures can hide important needs and misdirect resources. For planners, health services and policymakers, the message is that effective decisions must consider both how crowded a place is and who lives there. Cities and rural areas are not just bigger or smaller versions of the same community: their distinct demographic mix shapes risks, opportunities and the kind of support people require.
Citation: Sutton, J., Hanley, Q.S., Mortimore, G. et al. Comprehensive indicators and fine granularity refine density scaling laws in rural-urban systems. Sci Rep 16, 10461 (2026). https://doi.org/10.1038/s41598-026-40238-7
Keywords: population density, urban–rural differences, scaling laws, demographic composition, health and crime patterns