Clear Sky Science · en
Trend analysis of dam inflow data using the trend accuracy index and the potential-evapotranspiration correction factor
Why future water supplies are getting harder to predict
Communities depend on large dams to provide drinking water, support industry, generate electricity, and protect against floods. But as the climate warms, rainfall has become less predictable, making it harder for planners to know how much water will actually flow into reservoirs decades from now. This study tackles that challenge for a major river basin in South Korea and proposes a new way to judge whether computer simulations are capturing the long‑term direction of change in dam inflows, not just matching past numbers month by month.
How the study area reflects a changing climate
The work focuses on the Nakdong River basin, South Korea’s second‑largest river system, and on Hapcheon Dam, a key multipurpose reservoir in a steep, mostly forested mountain catchment. Rain in this region is highly seasonal, with much of it arriving during summer storms and typhoons. The authors compiled two kinds of information: past records from 2000–2019 and projections for the rest of the century from two climate‑change pathways, one moderate and one more intense. They gathered rainfall and temperature data from 101 weather stations, as well as measured inflows to Hapcheon Dam, all at monthly resolution. 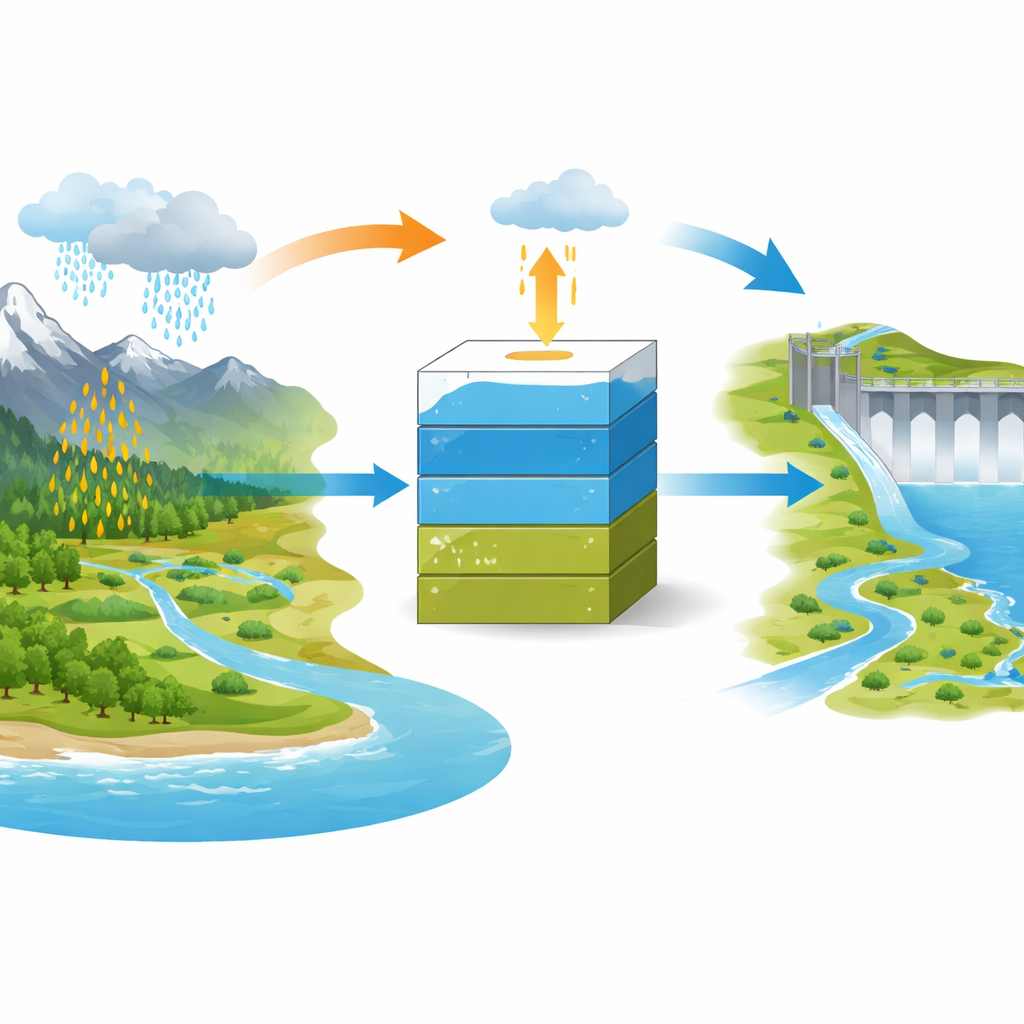
Grouping the rain to understand where it falls
Rain does not fall evenly across the basin, so the team used a clustering method to sort the 101 stations into three groups with similar characteristics. One cluster consists mainly of coastal stations that receive the greatest overall rainfall and the heaviest downpours. A second cluster covers lower‑lying inland areas with comparatively modest rainfall. The third cluster represents high mountain stations, which are wetter than the lowlands but drier than the coastal belt. This pattern holds not only for the recent past but also in the future projections, and it helps explain why nearby reservoirs, including Hapcheon Dam, see different inflow behavior depending on surrounding topography and storm tracks.
What the records say about shifting rain and river flows
Trend tests on the high‑quality station records revealed a complicated picture. From 2000–2019, many stations showed increasing rainfall in late winter and early spring, as well as in late autumn, but decreasing rainfall from May through September, including much of the summer rainy season. Annual rainfall tended to decline slightly. When the team repeated the analysis for future scenarios, they found fewer consistent trends, and the direction of change depended strongly on the emissions pathway and time window. Importantly, when they compared rainfall trends around Hapcheon Dam with trends in the dam’s inflow, they did not always agree. In some months inflows decreased even when nearby rainfall showed no clear change or even an increase. This suggests that other influences—such as temperature‑driven evaporation, land cover, or human water use—also shape how much water reaches the reservoir.
A new way to judge long‑term model behavior
To peer into the future, the authors used a relatively simple "four‑tank" model that represents water moving through layers of soil and shallow groundwater before reaching the dam. A genetic algorithm adjusted 13 model parameters so that simulated inflows would resemble observations. Here, the study introduces its key innovation: a trend accuracy index (TAI). Traditional scoring methods reward models that minimize average error, even if they fail to capture whether inflows are generally rising or falling over time. TAI instead emphasizes whether the simulated inflow goes up and down in the same direction as the observed record from one month to the next, with extra penalty when the model predicts a rise while reality shows a fall, or vice versa. The team also refined how they represent evaporation by applying a correction factor to potential evapotranspiration so that the model neither dries the basin too aggressively nor underestimates water loss. 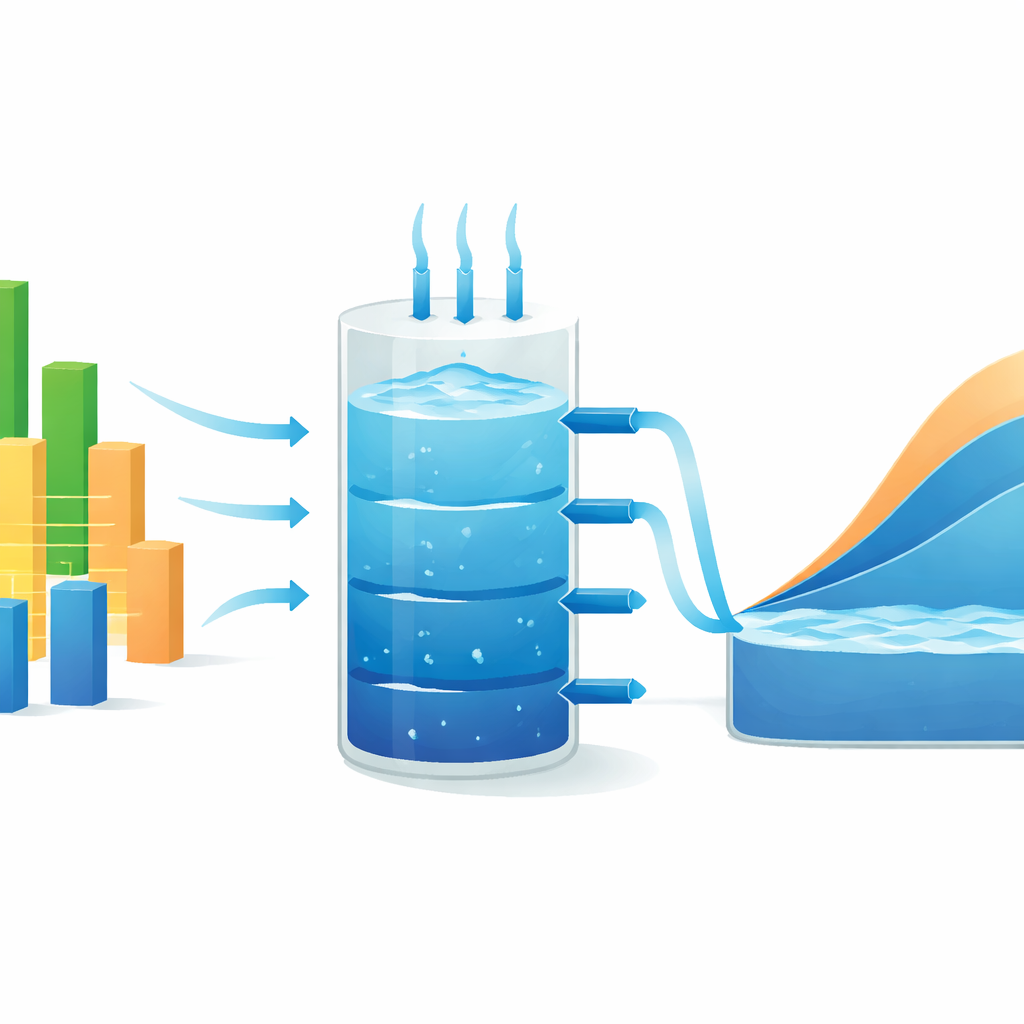
What the new approach reveals for future dam management
When they calibrated the model using TAI together with the evaporation correction, the simulated Hapcheon Dam inflows reproduced observed trend directions about three‑quarters of the time—noticeably better than when traditional error‑based scores were used. Verification with the most recent years confirmed that this setup maintained strong performance. Applying the calibrated model to future climate scenarios showed only a few clear inflow trends, such as an increase in late‑autumn inflow under one moderate‑emissions pathway later in the century, and again highlighted that rainfall and inflow trends can diverge. For water managers, the message is that planning solely around changes in rainfall could be misleading. By combining station clustering, careful quality checks, and a trend‑focused scoring approach like TAI, it becomes possible to build inflow simulations that are more trustworthy for long‑range planning of water supply and flood control.
Citation: Wang, Wj., Kim, H.S. Trend analysis of dam inflow data using the trend accuracy index and the potential-evapotranspiration correction factor. Sci Rep 16, 10040 (2026). https://doi.org/10.1038/s41598-026-40225-y
Keywords: climate change and dams, river basin rainfall trends, hydrological modeling, reservoir inflow simulation, water resources planning