Clear Sky Science · en
Simulation based new method for population variance using auxiliary information
Why smarter measures of spread matter
Whenever governments, businesses, or researchers run surveys, they do not only care about “average” income, yield, or test score. They also need to know how much these values vary across people, farms, or schools. This spread, called variance, tells us how unequal incomes are, how risky a crop is, or how uneven learning outcomes may be. The paper introduces a new way to estimate this spread more precisely by cleverly using extra pieces of information that surveys often collect but rarely exploit fully.
Seeing more than just the main number
Most survey reports focus on averages, yet many critical decisions depend on how scattered the data are. Estimating this scatter well is surprisingly hard, especially when only a modest number of people or units can be sampled. The traditional formula for variance works on paper, but its results can jump around a lot from sample to sample, particularly when the population is diverse. The authors argue that this instability can mislead planners who are trying to size surveys, set confidence limits, or compare groups under tight budget constraints.
Getting help from extra clues
Modern surveys usually record more than one variable: for example, a household’s food spending comes with its income, and a school’s number of teachers comes with its enrollment. These side variables, known in statistics as auxiliary information, often track closely with the main quantity of interest. If income and food costs move together, then knowing more about income can sharpen our picture of how food costs vary. Earlier work had already used such side clues to refine estimates of averages, but efforts to do the same for variance were more limited and often relied on simple, linear assumptions that break down in realistic, messy data.
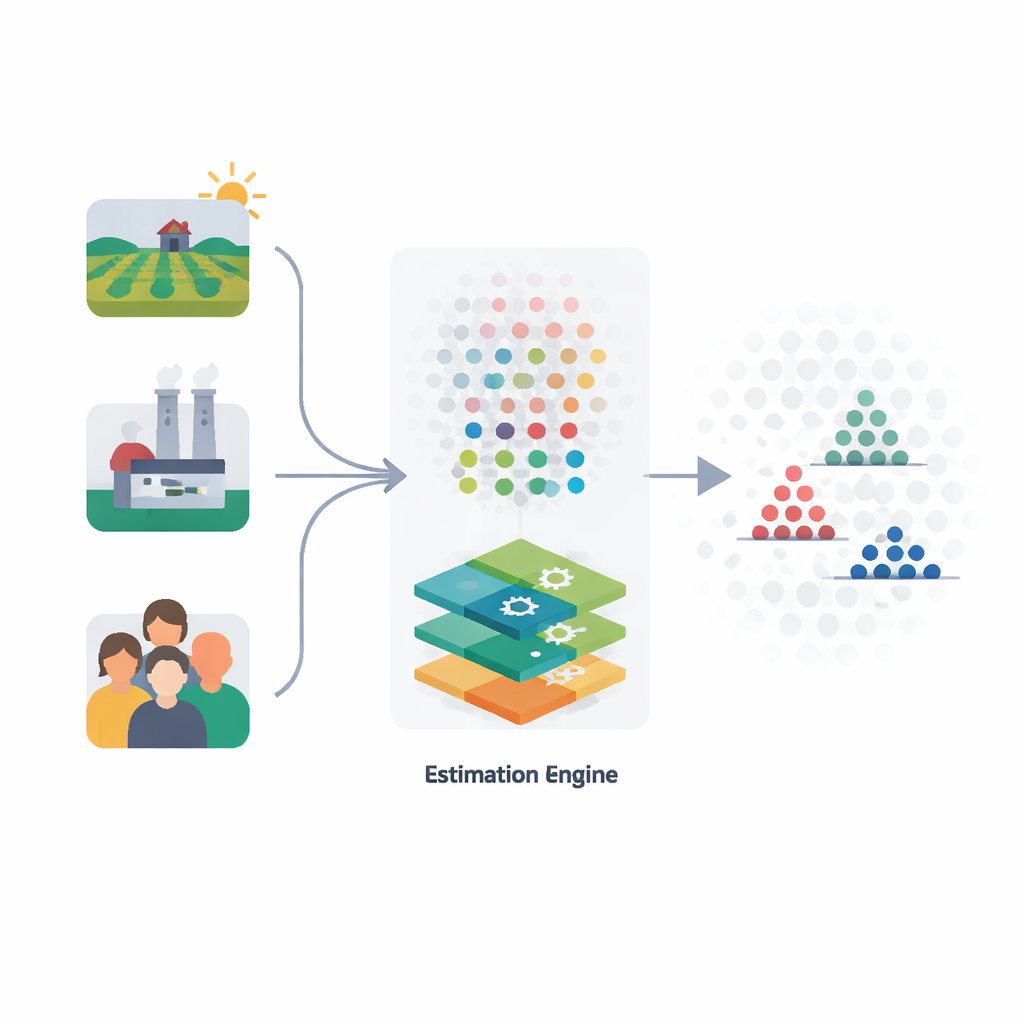
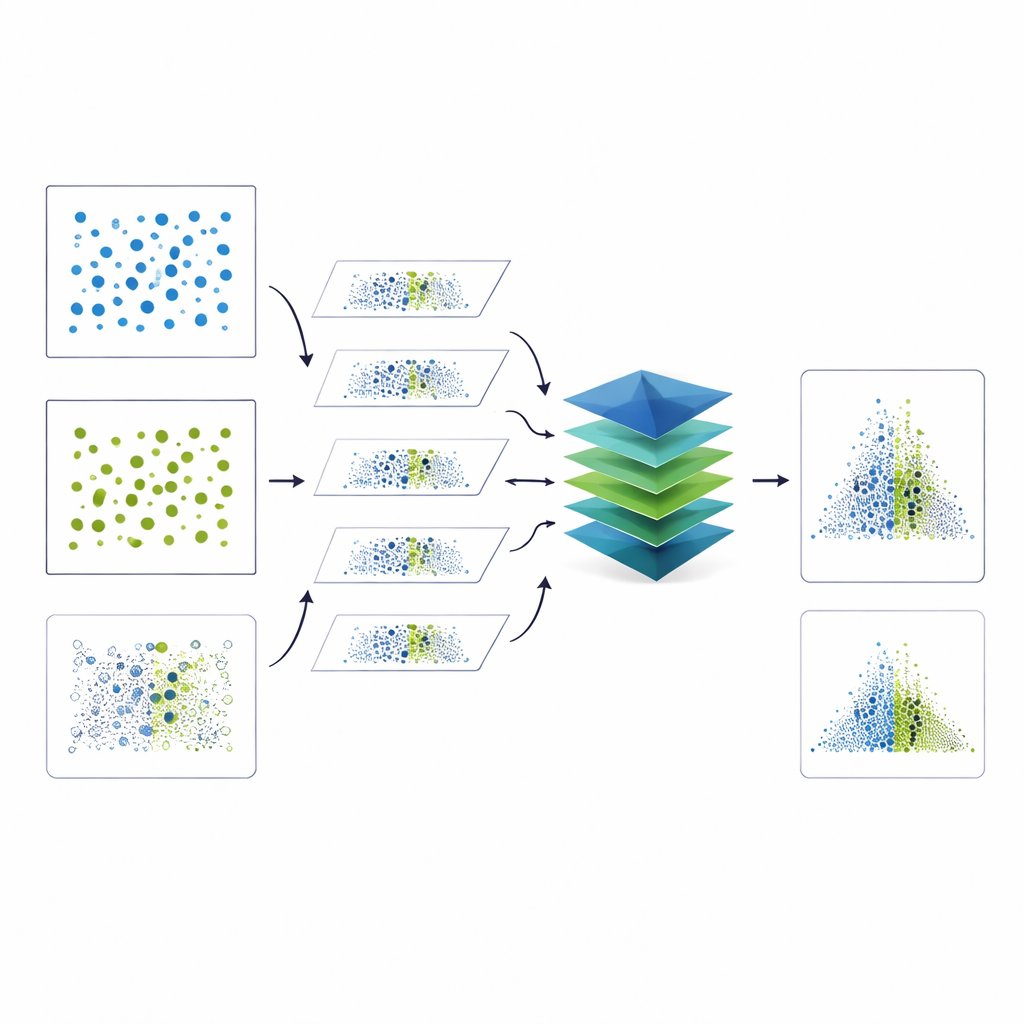
A new estimator built and tested by simulation
The authors propose a new estimator of population variance that directly blends the main survey data with an auxiliary variable in a more flexible way. Mathematically, they design a formula that mixes the usual sample variance with smooth adjustments based on how the auxiliary variable behaves in the sample and in the full population. To judge how well this recipe works, they first work out its expected error using standard theory. Then they move beyond pen-and-paper results by running large computer simulations that mimic many different worlds: populations with very strong, moderate, or even negative links between the main and auxiliary variables, and with different patterns of spread and shape.
Putting the method to work on real and simulated data
To see whether the new estimator helps in practice, the authors test it on three real data sets: family food costs paired with income, numbers of teachers paired with student counts, and counts of insects paired with exposure to treated packets. They compare their method to a series of well-known alternatives that also try to use auxiliary information. Across all three examples, the new estimator consistently delivers smaller average squared error, meaning its estimates stay closer to the truth. The gains are especially striking when the main and auxiliary variables move closely together. The simulation studies tell a similar story. In artificial populations created from bivariate normal models, the proposed estimator repeatedly shows both lower error and higher relative efficiency than standard and competing methods, even when relationships are complex or correlations are only moderate.
What this means for real-world surveys
For readers outside statistics, the key message is that survey designers do not have to accept noisy measures of spread as an unavoidable nuisance. By feeding extra, already available information into a carefully built formula and testing it thoroughly with simulations, the authors show that one can obtain more stable, reliable estimates of variability without increasing sample size or cost. Better variance estimates translate into better planning of future surveys and more trustworthy conclusions in areas such as agriculture, economics, and social science. The work also opens the door to extending this idea to more complex sampling plans and richer sets of auxiliary data, promising even sharper tools for understanding how unequal or uncertain our measured worlds really are.
Citation: Ahmadini, A.A.H., Semary, H.E., Ahmad, S. et al. Simulation based new method for population variance using auxiliary information. Sci Rep 16, 11647 (2026). https://doi.org/10.1038/s41598-026-40161-x
Keywords: survey sampling, variance estimation, auxiliary information, statistical efficiency, simulation study